Pitchfork trading, multi-time frame and the scaling factor

This is going to be an important lesson for your perusal. Please take time to read it carefully, it contains essential information to increase your trading efficiency.

We want to discuss today how to trade with pitchforks in multi-time frame (MTF) environment. But before all, one must understand why we are doing it. It is not a matter of confirmation higher / lower time frame, it is not a matter of being more comfortable pending on your personal constraints, it is about decreasing risk and increasing profitability!

Before we dive into the pitchfork trading, let’s understand MTF risk reduction strategy and how we can decrease the risk by scaling DOWN and increase profitability by scaling UP !

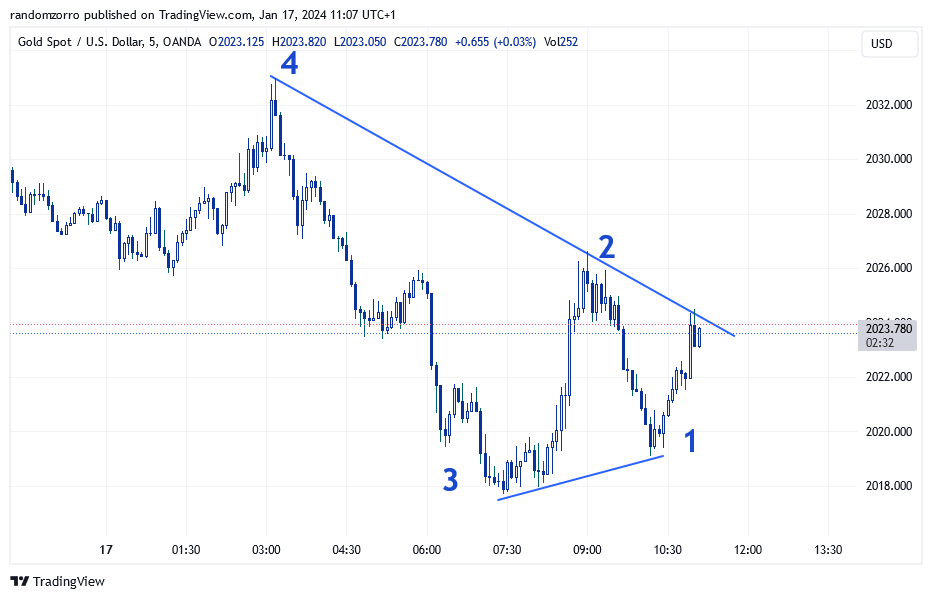
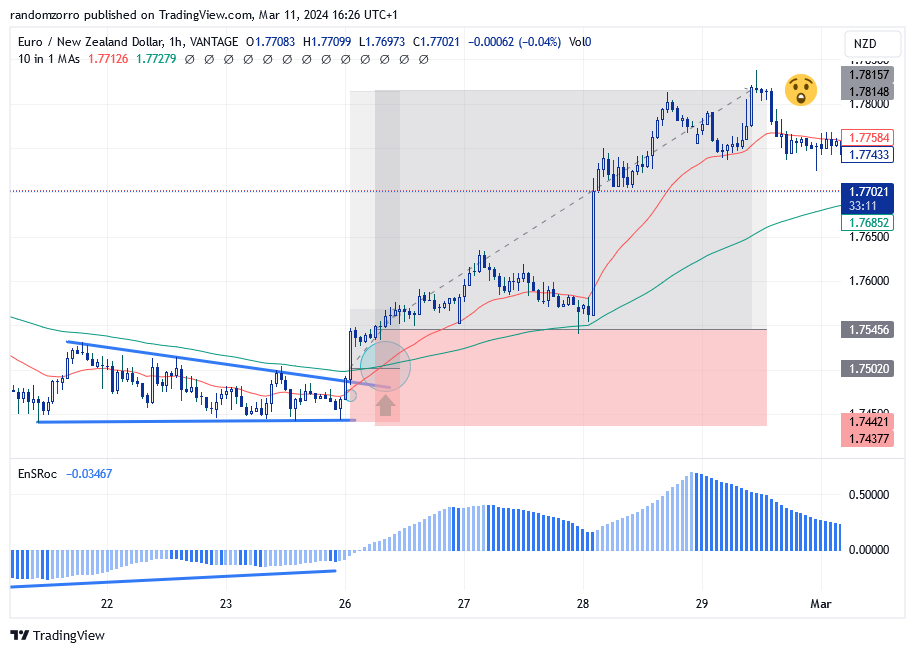
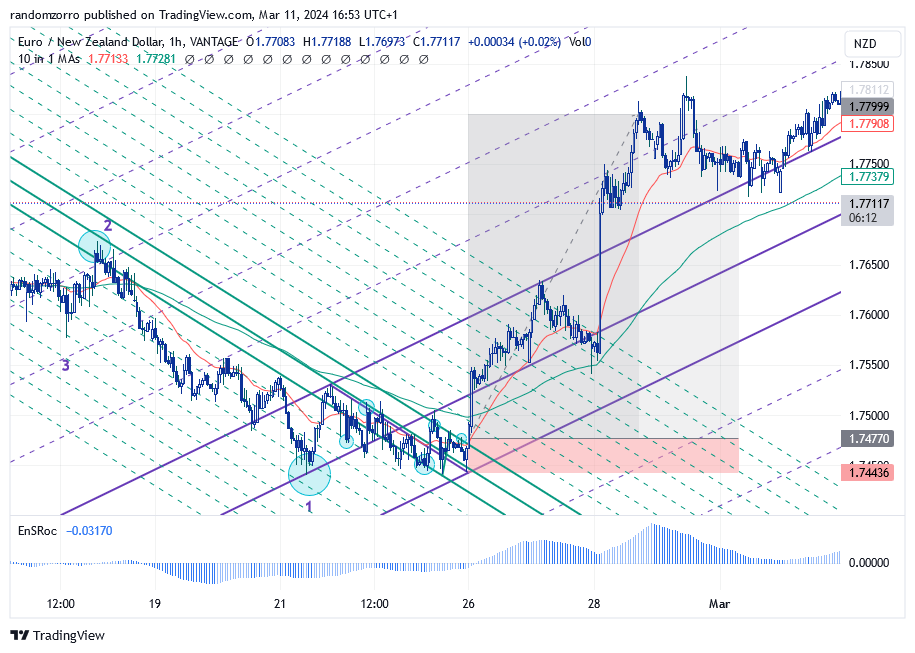
For this lesson, we are going to trade EURNZD. Let’s look at this recent price action on the 1-hour graph:

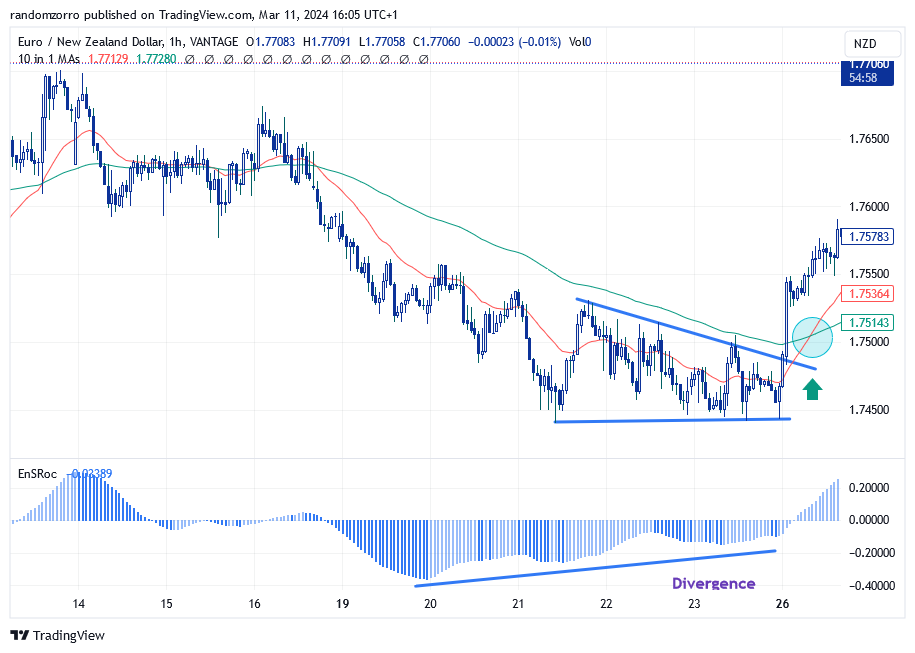
We have two moving averages, 25 and 100 EMA’s, and a smooth ROC indicator which does not care too much about which EMA you enter as a parameter. You have of course noticed a divergence with the ROC. You have even have drawn a kind of triangle of which escape yields a buy signal. However the red short term EMA is lower than the long one, so you may want to wait for a last confirmation with the crossing. Then you enter a trade, stop loss (SL) below recent low and target a 2.5 risk reward ratio (for instance):

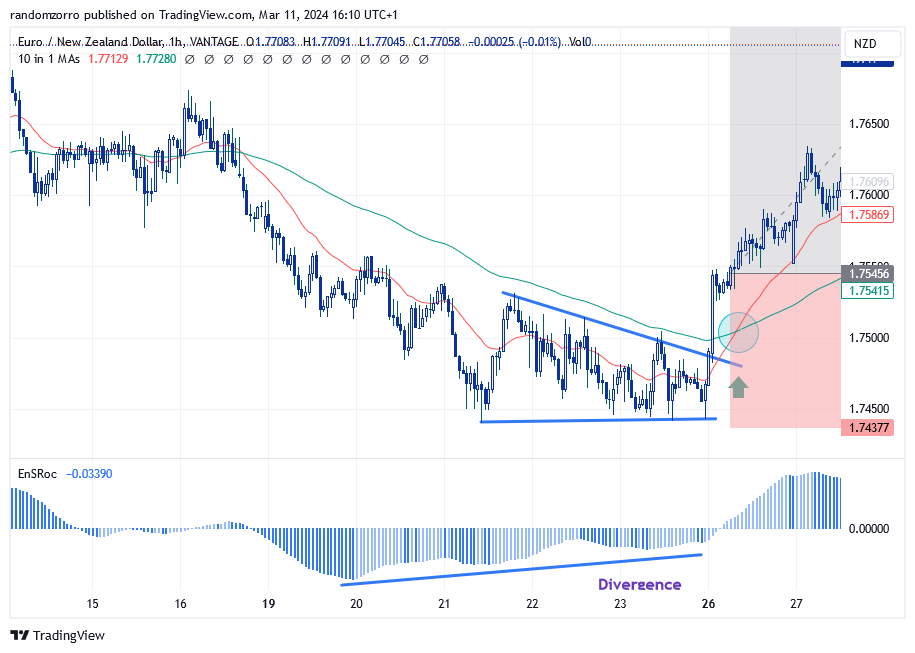
Your risk is 1.75456 (entry price) – 1.74377 (SL) = 0.01079 NZD

Can we do better?

Let’s scale down to 15 min, meaning we switch the time frame of our trading software to 15 minutes. Same triangle but of course the moving averages have changed and the crossing is done when we exit the triangle! Momentum is positive and increasing. So nice!

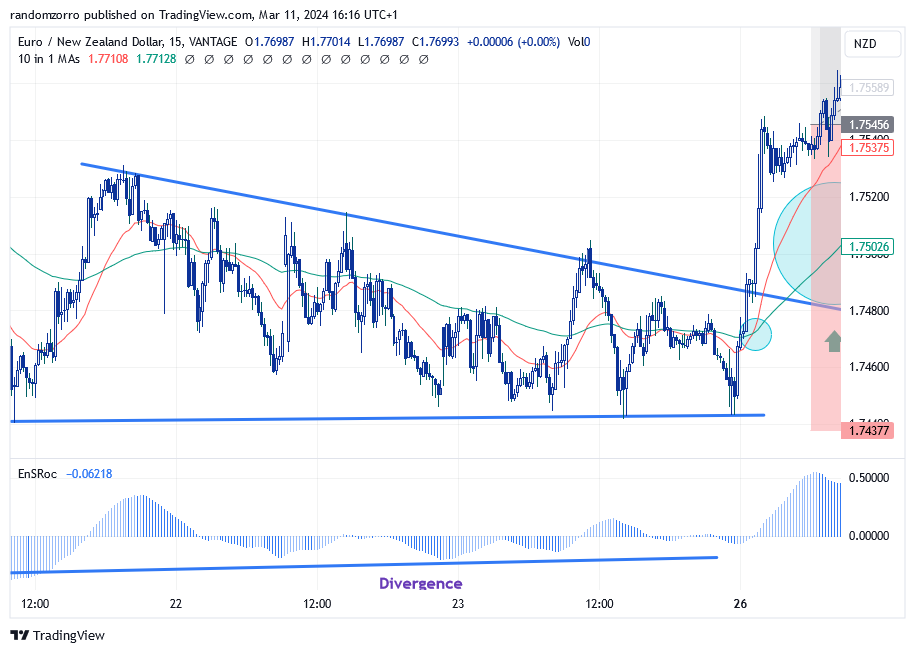
So I can place an order on this time frame.

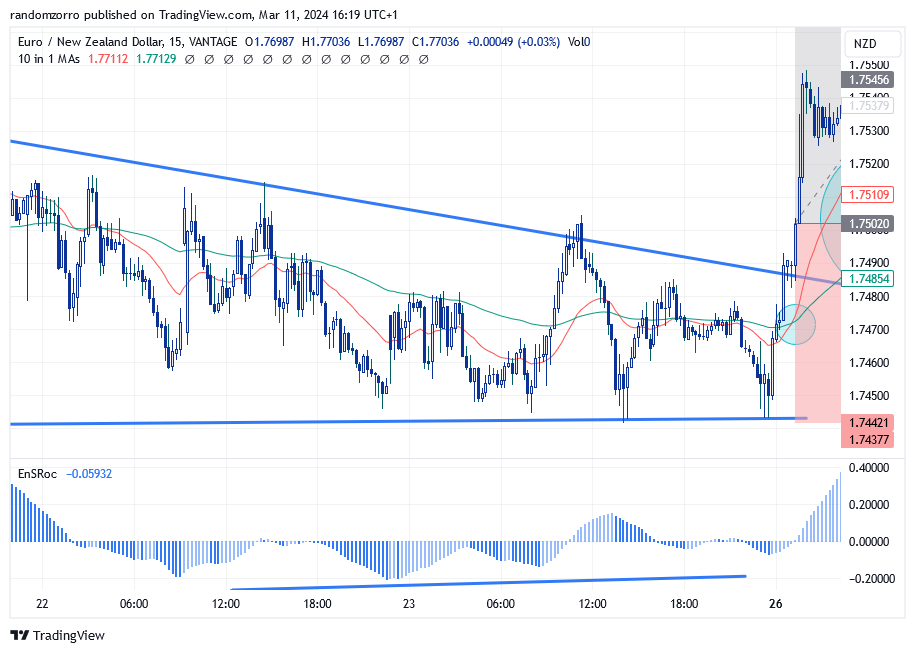
I keep the same target price and stop as before, but I have managed to enter at a much better price, and my RR is enhanced from 2.5 to 5.22! For 10$ risk, I might earn 52.20$ instead of 25$, more than double my profitability.

What about risk? Risk is now 1.75020 (entry price) – 1.74377 (SL) = 0.00643NZD, therefore a 41% risk decrease!!!!!

How did the trade go? Perfectly!

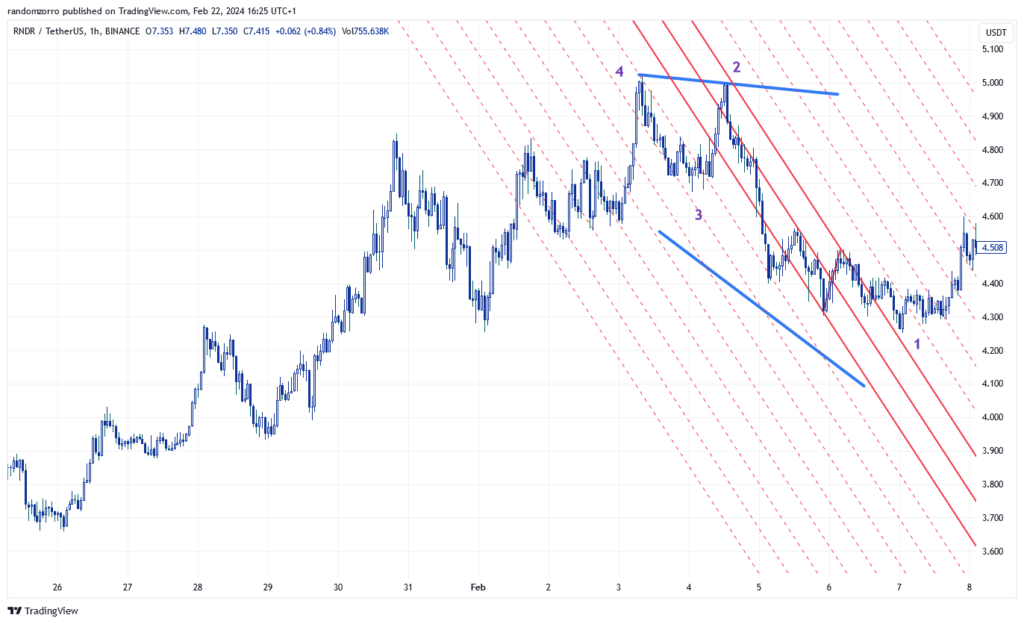
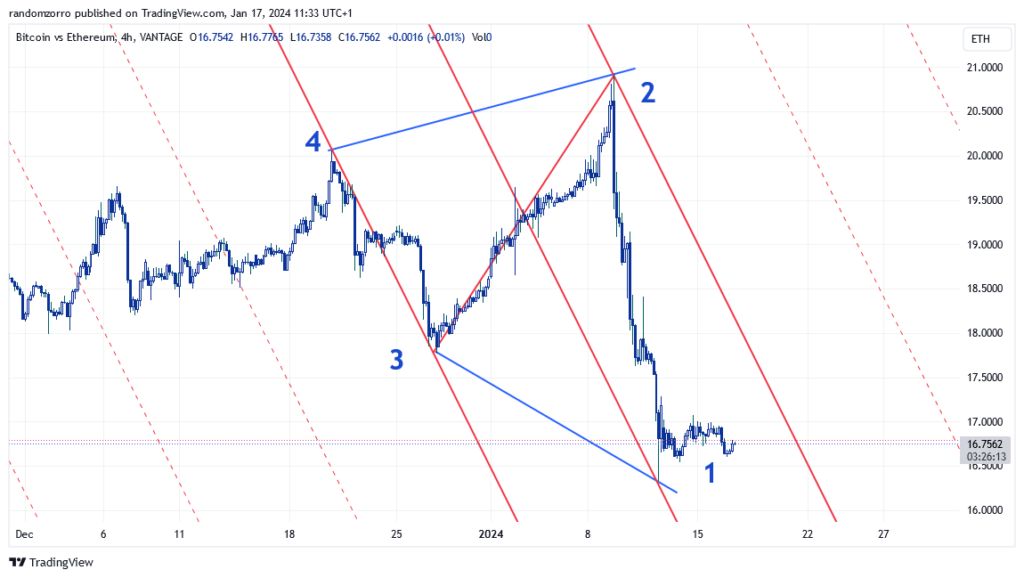
How does this relate to pitchfork trading? As you may remember, pitchfork gives us some sweat as we need to identify market structure, take the pitchfork, which may work or not during validation. So we don’t want to draw it on 1 minute charts! For the trade above, let’s see what can be done

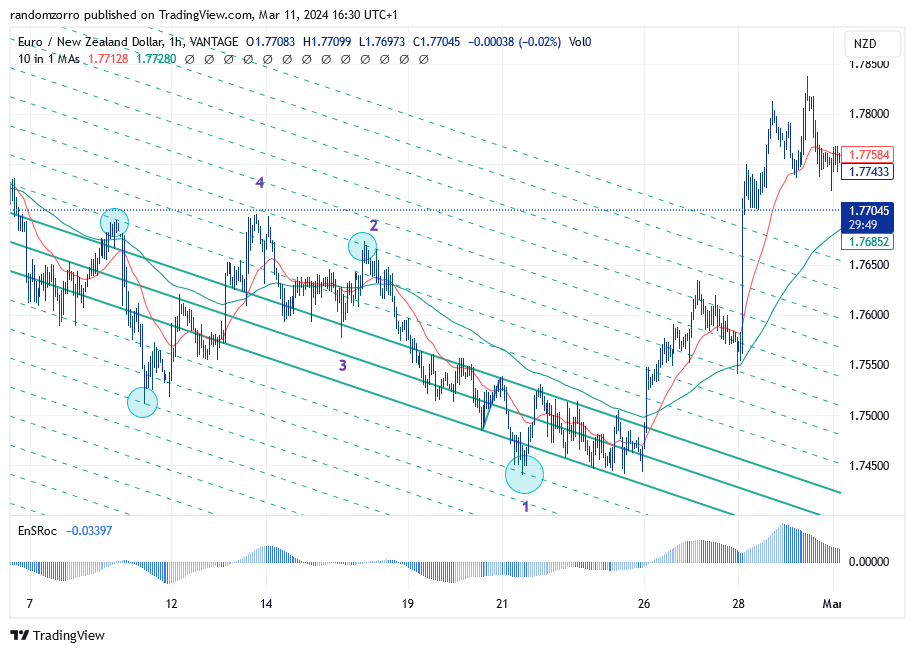
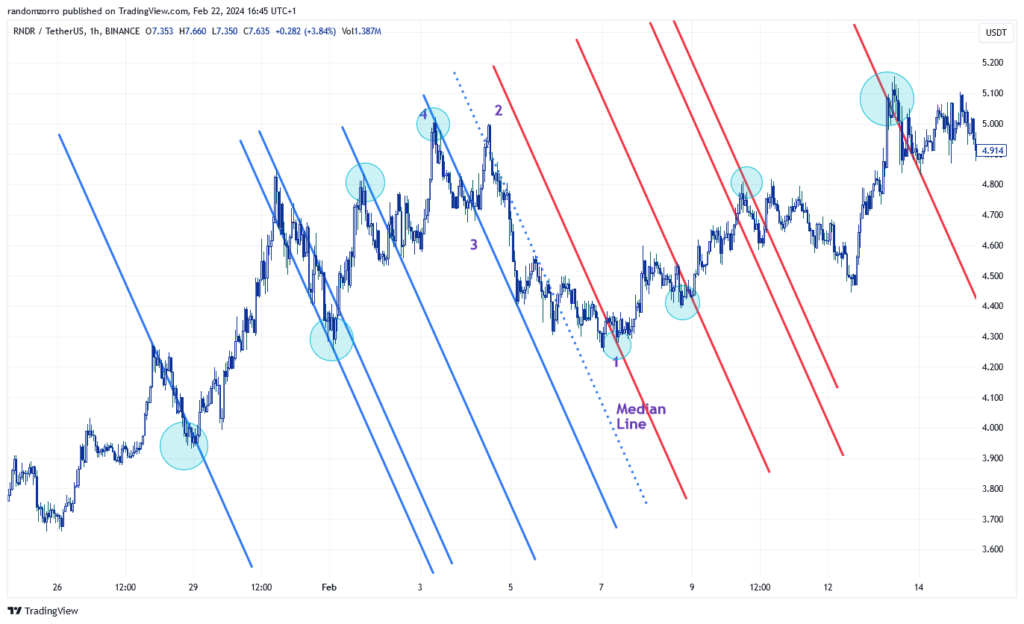
Market structure is obviously a down trending one, but the mini-pitchfork did not make me comfortable so I had to hybrid it (more on that in future posts). Now I have multiple contacts with warning lines. I feel better and I see prices exiting the pitchfork at the same timing, more or less.

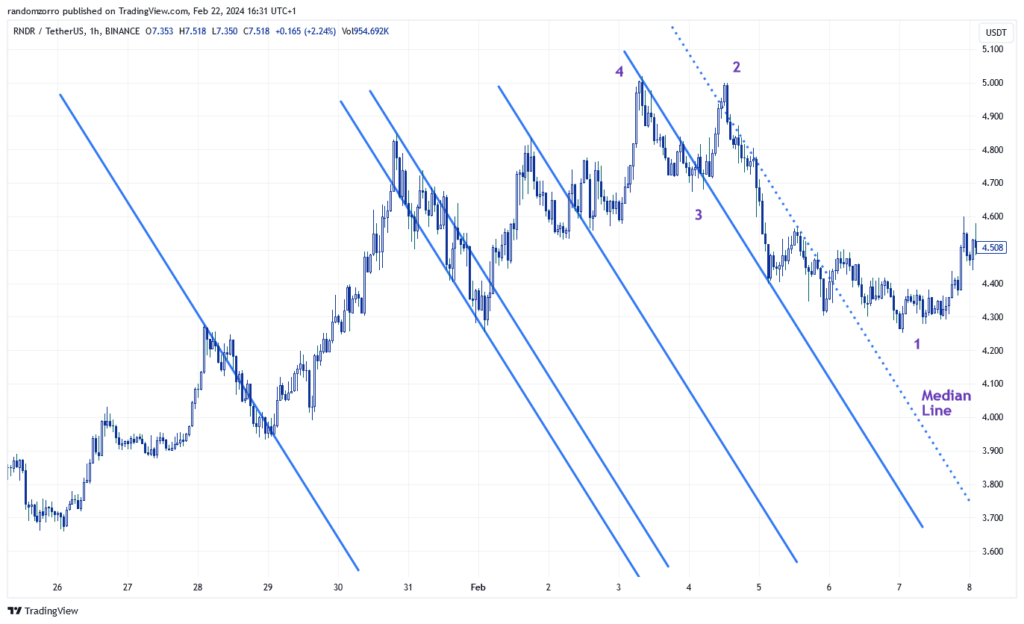
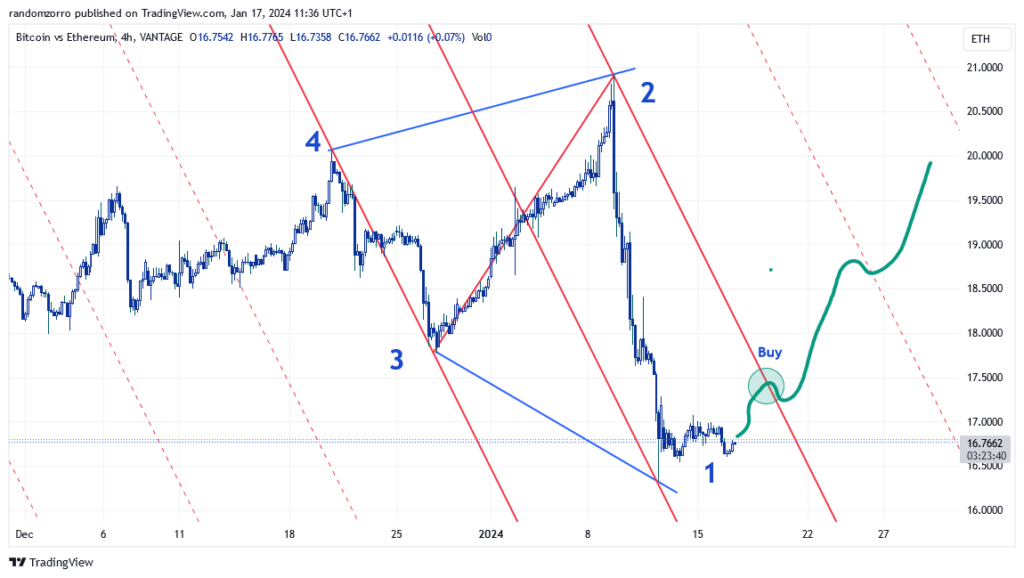
Now you can draw a new pitchfork as SP1 is fully confirm to be a local trough, and a SL can be placed below the lower MLH:

You can of course move your SL along the lower MLH to make a trailing stop!

Your risk is 1.75450 – 1.74436 = 0.01014 NZD

Can we improve?

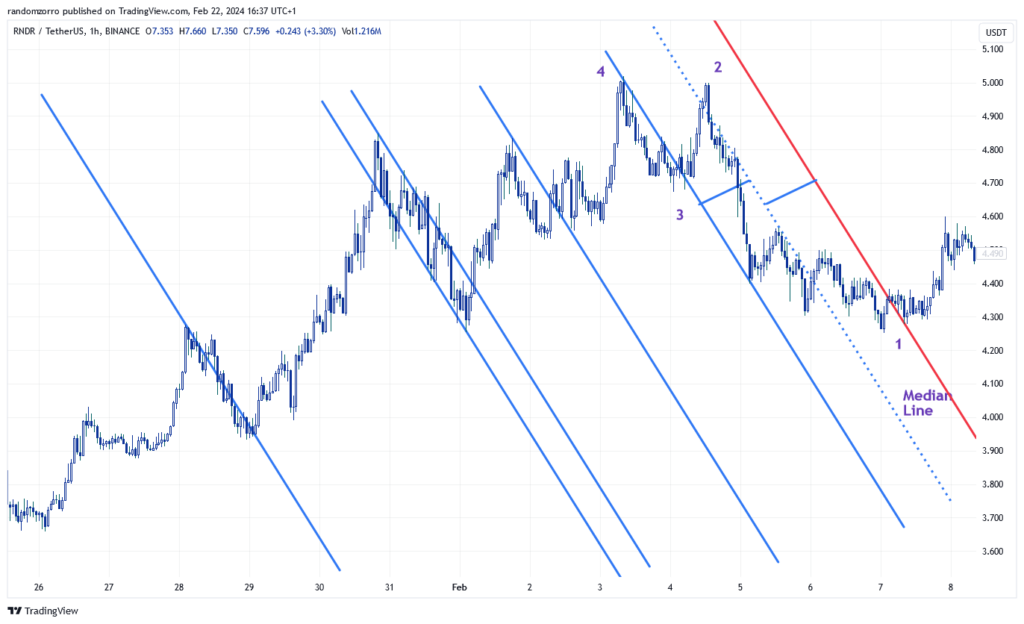
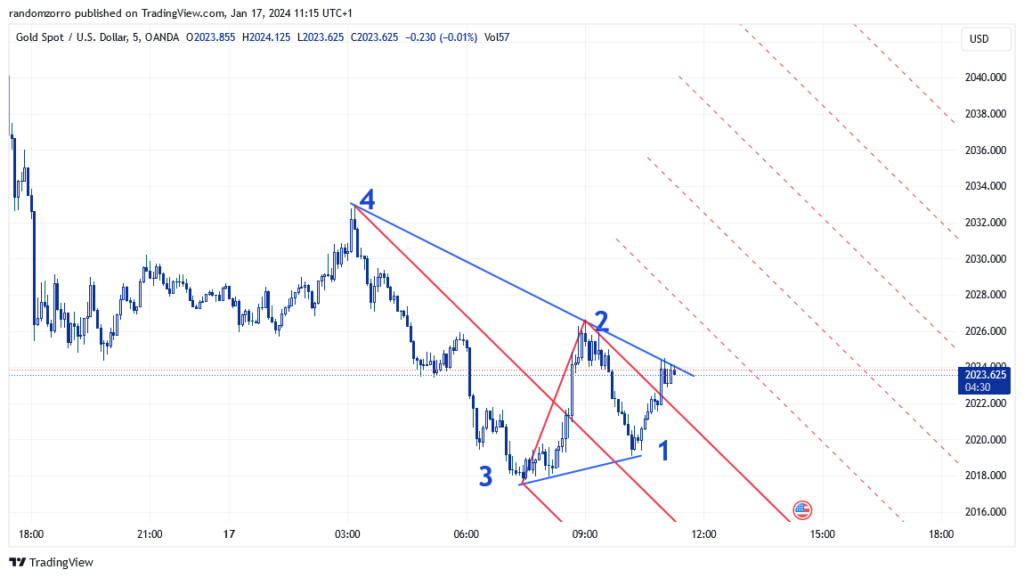
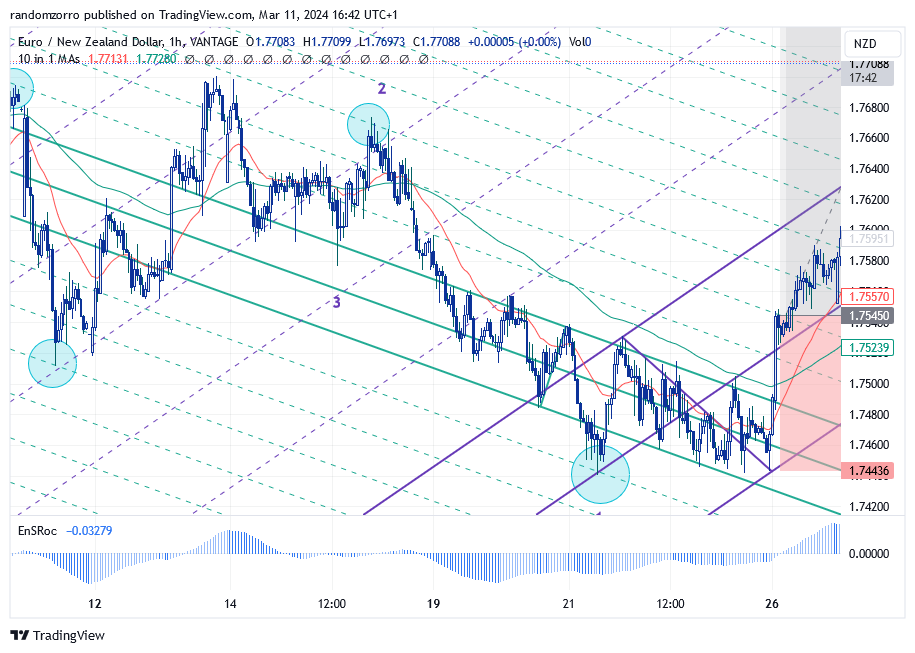
Well yes! We can keep the purple pitchfork but on 15 minutes, you need to find a new trigger pitchfork (green one) with new market structure at that level:

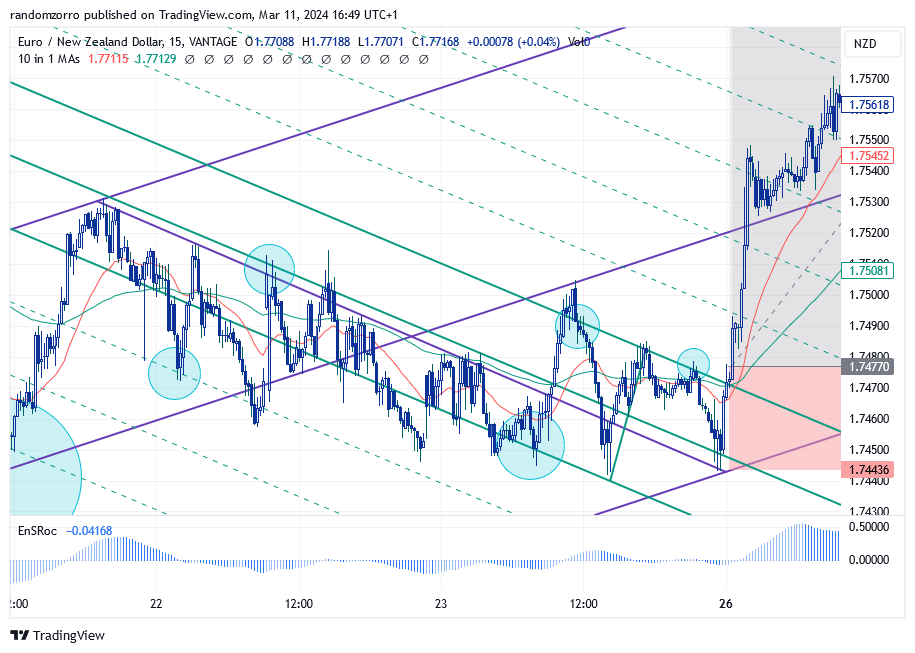
Place buy order on top of the exit candle. Now your RR has hiked from 2.5 to 9.57!!!!

Your new risk is 1.74770 – 1.74436 = 0.00334 NZD so a 77% risk reduction.

Of course same trade turned out the same

Whatever trading system you use, you can get the same benefit from scaling down.

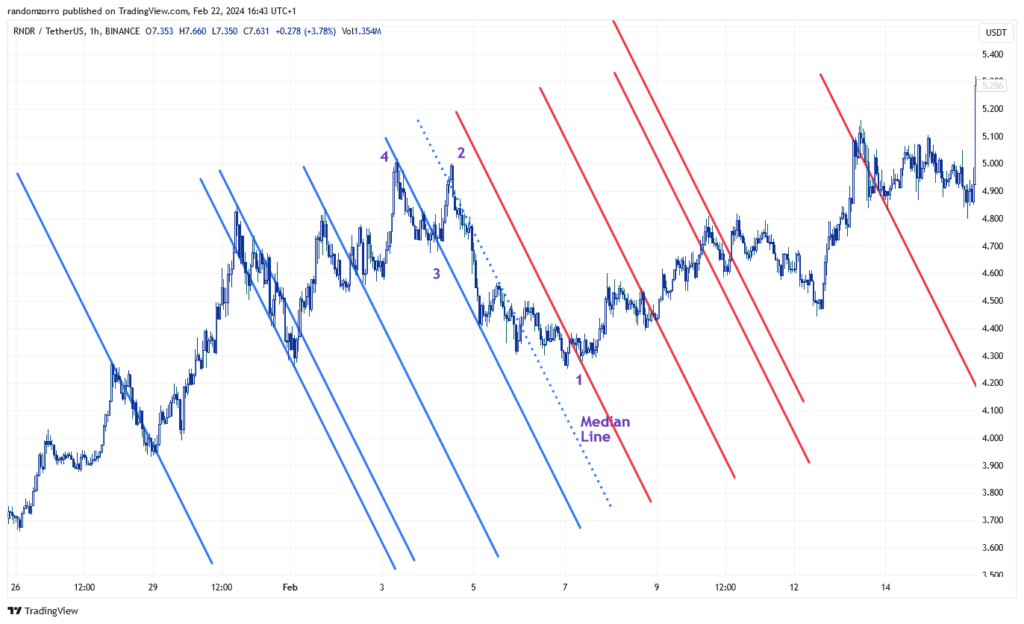
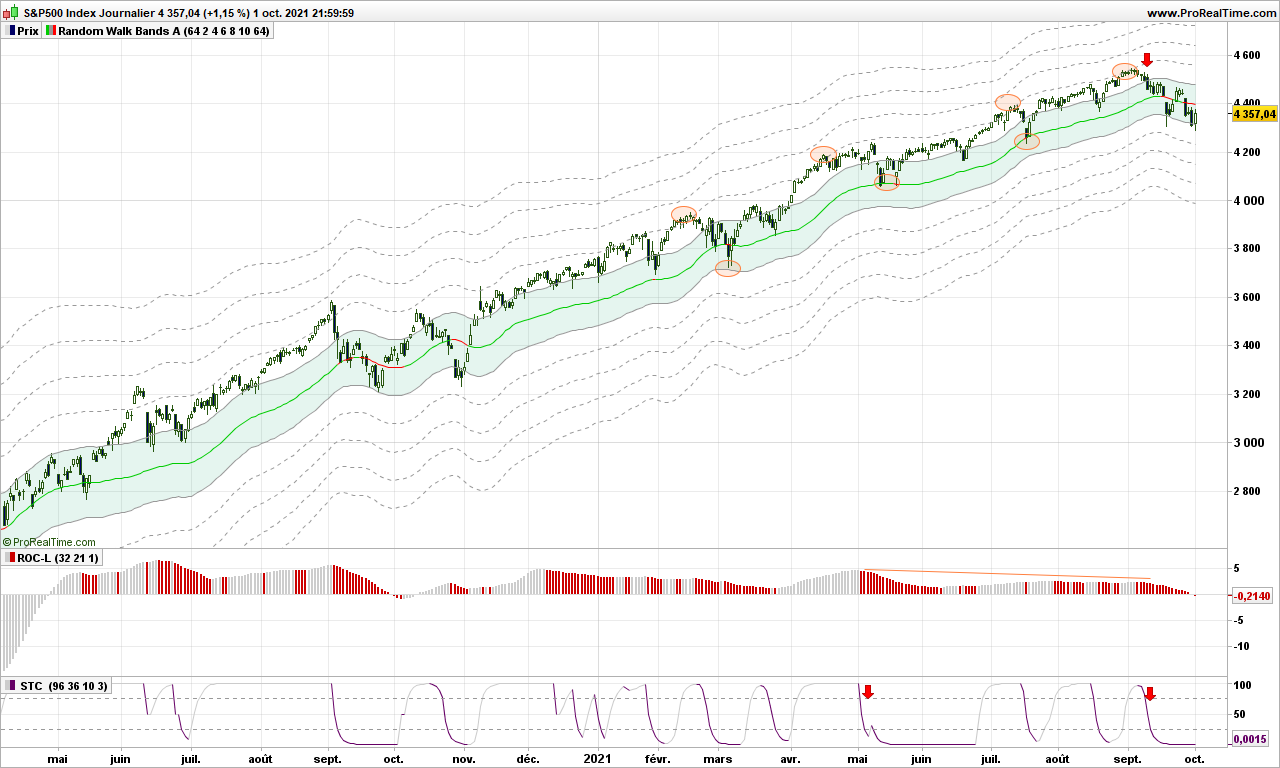
Now let’s look benefit of scaling up:

On the 4h time frame, once we get a similar golden cross between the short and long EMA’s, we are allowed to scale up:

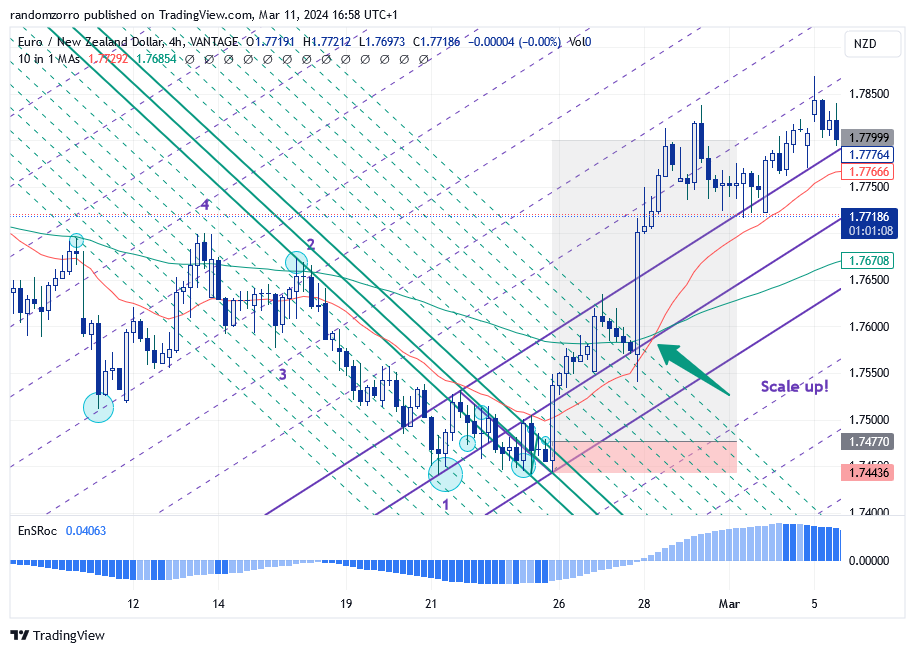
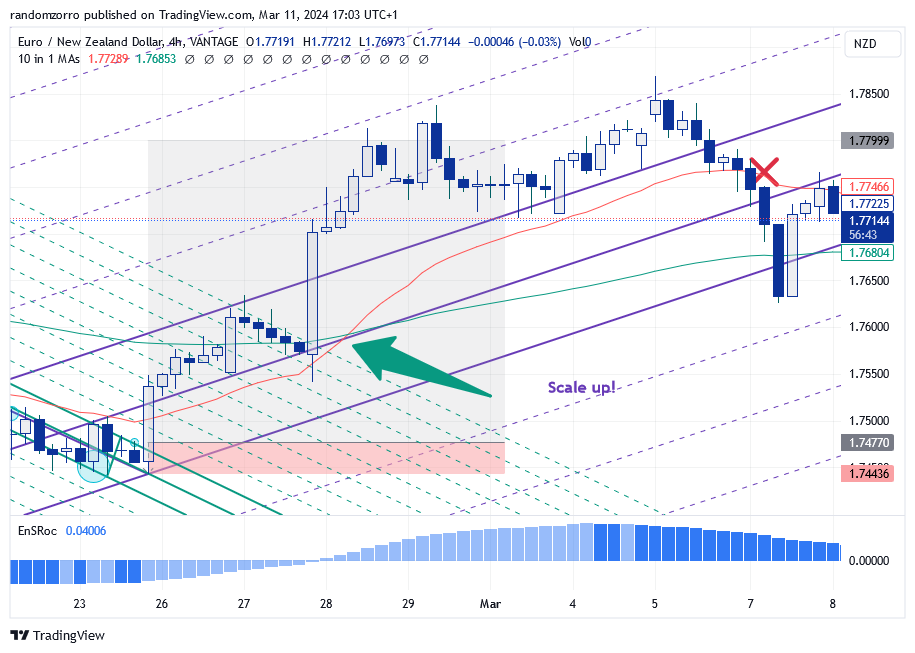
After the golden cross, your trade is hugely profitable, so you want to secure some profit. For the remaining of the line, you may want to target extra profits. Place your trailing stop below the red average for instance and let your profits run for as long as the market wants.

In this particular case, it did not work but my RR was around 8.

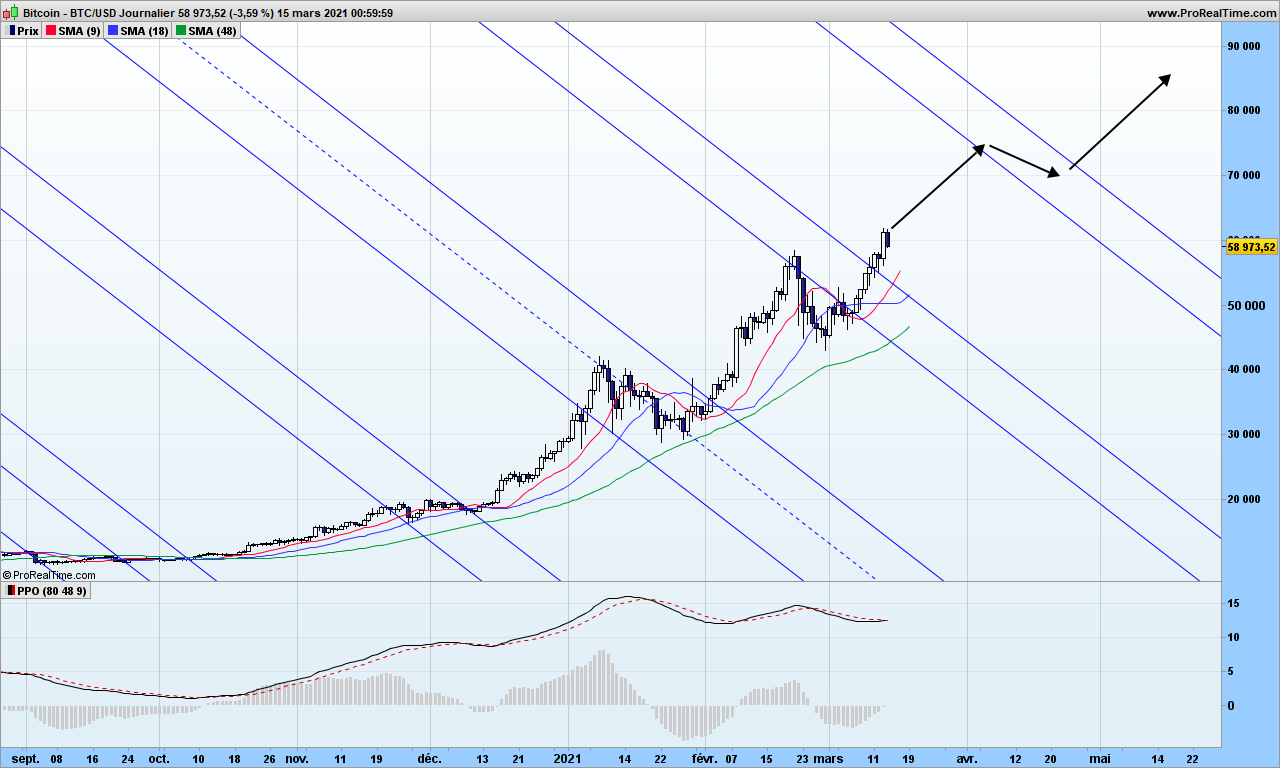
That’s it for today. The example was with forex today but it is of possible to use this strategy on 5min/1min time frame or on crypto and you could get huge RR’s (>30) from time to time. Enjoy.

And until next time, trade safely!

Pitchfork generalization – introducing the action-reaction lines

Trading with a pitchfork requires selecting three consecutive swing points (trough, peak, trough or the opposite) and then draw the pitchfork and validate it by checking it describes accurately price action in the past, in order to guess price action in the future (aka reaction).

Starting from market structures (see previous post), there are some recommended pitchforks to be used, but sometimes unfortunately the warning lines do not confirm the validity of the pitchfork. There exist hybrid pitchforks which we will study in an other post. For now, we are going to discover the action and reaction lines.

In theory, any price action in the past has a symmetric price reaction in the future, the mirror being the called the center line. Center line can of course be the pitchfork median line you have just drawn, it can be also a high-to-low line (see previous post) or it can be a multi-pivot line, i.e. a straight line that contacts at least 3 swing points (peaks, troughs…), what traders call a slant support or resistance line. Horizontal lines are a non sense for this study, since they only deal with price, and vertical lines also as they only deal with time, but studies show this is not (or no longer) relevant to today’s markets.

Theory continues by saying that any swing point in the past could have its image in the future. To be accurate, the action line passing through a swing point (peak or trough) in the past can be mirrored in the future, and there is a strong chance that a new swing points will sit on this line.

Let’s stop the theory and study an example. We are going to trade RNDR crypto for this example in the 1h time frame.

At this point in time, we have identifed market has bottomed out after a strong downtrend structure. As recommended I have drawn a mini pitchfork of which slope does not make you very comfortable buying this market. I will keep only the median line and will start drawing parallel lines to this median.

The median line is now represented with dotted line and I have drawn parallel to the median that go through peaks and troughs. You have to try, it is very easy! Doesn’t it start looking like a pitchfork with teeths separated in uneven way?

Next exercise is simple. We need to note the distance between the action line and center line (the mini pitchfork median line) and draw the symmetric lines on the opposite side of the median at the same distance!

I have drawn the first reaction line in red color. You will want help by drawing a segment to measure distance and move it or duplicate it to get the right distance to reaction line. Notice that trough 1 is now inside the new ‘pitchfork’ and it is a better looking buy signal. Notice also how this line is perfectly re-tested by the market after going above, which gives validity to this drawing.

We need to the same with other reaction lines! There you go:

Now let’s look at peaks and troughs

I have selected this chart at random, trading it on the fly, I had no assurance this would be a nice example! Look again! Peaks in the past have yielded reaction troughs on the reaction lines, troughs in the past have yielded reaction peaks on the mirroring reaction lines. True enough there are new peaks and troughs that were not anticipated, but remember markets have fractal structure, you could probably have found them by analyzing other time frames!

Please not ealso the accuracy of reaction lines decreases after a dozen re-actions lines. When you have identified a new market structure, better draw a new center and re-do the exercise!

Starting from last 2 center lines, we should have up-sloping and down-sloping action and reaction lines, of which the intersect can yield the exact position of a peak or trough in the future. Which we will see in an other post.

Until then, trade safely!

Pitchfork trading: selecting the right model!

In previous posts, I have made a quick introduction about all pitchfork models, from the basic to the sporty ones and explained the buy / sell signals and how to spot potential targets in terms of price and time. We will have to dig much further into this, be warned pitchfork trading is not just a tool, it is a special art with long training process!

This post will tell you which pitchfork model to select based on market configuration. Previous post highlighted you need 4 swing points that form a falling wedge to identifiy a buying opportunity. But wait, market does not always show this configuration!!!

Gold in above figure does not show a falling wedge, it is more a horizontal consolidation zone, right?

Exercise!!! Given we are looking at a set of 4 swing points, how many figures can we build?

The answer is 6 but I will let you think about it :-))))

In the case, drawing a basic pitchfork yields this:

This example being chosen randomly, it looks not too bad at first sight. SP1 is not sitting on median line meaning market strength and price exit nicely from the pitchfork to hit the hagopian line. But wait, we missed the falling wedge requirement!!! So the analysis is not valid!

For such configuration, the median slope is usually too high (in absolute value) to be of any trading sense. This is why you should change the configuration to Schiff mode.

The chart now looks like this

See the difference. SP4 has been moved vertically down to middle height between 3 and 4. Now we see that SP1 is below the median, then prices have gone up, hit the MLH and … are most like to revert down to median. I have tested and this scenario is much more likely than the previous one.

Now Let’s look at an other example

Ouch, it hurts. Can’t do anything with pitchfork, right? By the way, this is one of configuration expected from the exercise :-))

Drawing a basic pitchfork won’t give any buy signal before long long time :-))))

So first we draw an original pitchforlk (not Schiffed) but starting from last swing point

Then we extend the lines

SP1 is of course perfectly located on the median line. Now you just need to wait for prices to get out of the pitchfork.

In the next post, I will show the 6 configurations and which pitchfork applies in each case.

In the meantime, trade safely!

All we need is a big blue swam bringing hope back home!

You know what? Communism has failed. Ecologist predictions of last 50 years have all failed. Big pharma have failed to find a vaccine against AIDS. Titanic has failed to cross Atlantic Ocean. Napoleon has failed creating a kind of European union. Romans have failed to keep their Empire together.

History is full of miserable failures but we don’t seem to learn from our mistakes. Nassim Taleb has found that somehighly improbable events ending up with drastic consequences could be due to a black swam. The idea behind if that you have never seen a black swam, you probably doubt they exist, not talking about predicting their showing up!

Was Covid a black swam? If you are a bit interested in big pharma history, you would know how they work. Their life would be very boring without epidemics, or even better pandemics where one can start making very good business with medicine, vaccine, medicine to cope with vaccine adverse reactions, improved vaccines, new medicine even long after the virus have completely disappeared. Since pandemics do not show up that often, it is best to create them, or at least let know all of us that there is one potentially very harming lurking by the corner of the street. This is what happened with AIDS, they said it was discovered in San Francisco, without giving any details, and then people started to get feared… fortunately this time, they could find a sellable vaccine. But how many times did they try? H1N1, Spanish Flu, …. No Covid is not a black swam, it has been long clear enough big pharma would try an other time to make big money!

Now if black reminds you of dark times, of morbidity, of whatever ghost stories, … all we need now is a big blue swam of hope!

Let’s be honest. Black swams are not that common but blue ones are even more rare, they will only show up if we all want it to appear!

Blue color is about hope, a bright future, water and sky, peacefulness, it brings positive values and tends to relax the eyes (try it, look at a blue sky!). We don’t want to talk black things any more: illness, death, mysterious societies, … As long as we play their game, they have the winning cards. If we have a strong positive message, they will be just ignored. Let me take one example: many doctors and health care workers have lost their job for rightfully rejecting the jab. What about they start a new life preventing people for becoming sick? Even communist party in China in the 1950’s pushed people to practice taichi chuan so that country is full of healthy people (that was before McDonald arrived in China). There is a lot to be built upon, it is not even secret!

Now let’s see if there is some positive news on the market!

S&P500 seems to be taking a bearish turn. The smoothed ROC has turned negative but careful there are hidden divergence (which I am therefore not showing ;-)) We have to stay optimistic!

Just look at how nice the S&P500 has sticked to the dotted warning line on this weekly chart. If index returns to green line (the random walk path), everyone can understand the bullish trend is intact.

Bitcoin chart is unchanged. I have seen many Hoorays with last days price action, but be careful!

Gold is still is in a flat market. Let’s look at weekly chart just below. As long as the price is enclosed in the green area, you can take the opportunity to accumulate. Price is probably kept under control by institutions which think we are stupid enough and won’t buy gold at this price! You bet! Inflation is here, hyper-inflation will come sooner or later, we will see an other big financial failure, and everybody knows having gold is the safest way to go through any crisis. We have a second solution which is Bitcoin, I will write something about it in an other post.

Uranium is one of them ressources to have these days, so I wrote a few weeks ago. It has gone up to one my highest warning lines. Now it is back to random walk path which is undoubtedly a nice entry area. As explained previously, wind farms and solar panels won’t do the work!

Platinium may wake up in coming weeks. Divergence with smoothed ROC, hitting the first warning line and buy signals on short term indicator. We are almost there.

That’s it for today. Aim at that blue swam! And until next time, trade safely!

Inflation? Hyper-inflation? No, a conspiracy theory!

Have you noticed any inflation? Pasta price up, gaz price up, … Everything you can buy, price seems to go up! According to IMF, it is only temporary and if you say otherwise, you are a conspiracy theorist! I must be one then :-))

Covid Kingdom is still under construction and they want each and all of us to participate in this exciting new adventure where a few people own everything and you get nothing, you will be enslaved to your master. There is one thing however that will make them fail: they are extremely bad economists, they are playing with the money and the money is exploding right now into hyper inflation fireworks, which will signify the end of the game not too far away! Get Gold, get bits of Bitcoin and you should be safe.

Bulls are still out there, because plenty of cash is there so only few industrial constraints prevent from going higher faster. This is what we see on Semi Conductor index:

Price Channel have no specific sense but you see that the one I draw is in sync with medium and long term indicators. Only short term shows weakness. Silicium might be missing so companies like Qualcomm will only increase their selling price while waiting to manufacture more. There can still be a drop to 3000, which be a good oppoortunity to invest, especially in light of 5G deployments.

Coming back for a second on inflation, you can see below that ground coffee price has just doubled in 2021. Here is the deal: consider how many coffee you drink in a year, do you yourself a favor by buying stocks of a coffee company, they give dividends so you get free coffee!

I always mention oil on this blog, because without oil, our society will just stop! No more cars, no more plastic, … Green electricity will not replace oil. Take a note: green electricity will not replace oil. NEVER!

Crude oil is up 10% since last post. Good for your portfolio. Of course, you need to have many stocks of Exxon, BP, … if you want them to pay oil for your car with dividends. At least, it may buy you extra free coffee!

If you wonder why gaz is more and more expensive, just look at the chart: +128% since Jan 1st! This is not going to stop any time soon. Windfarms are deployed everywhere, but since wind is not a continuous supply, then you need a gas power plant to manage electrical grid. Gas supply being limited by other geopolitical issues, price can only go up!

Last one for today is Bitcoin. BTC is still quietly hanging around, gathering ressources for the next leg. This next leg will be up towards 100k$. That is because of wider adoption (Salvadore, …), it is safer than fiat money, it does not have a country (miners can hop to new country any time), transactions costs become faster and cheaper with Lightning network. While I expect price will go down to 35k$, I am waiting for this cheap entry!

That’s it for today. Until next time, trade safely!

There is no such thing as self-fulfilling prophecies!!

Extract from Britannica:

Self-fulfilling prophecy, process through which an originally false expectation leads to its own confirmation. In a self-fulfilling prophecy an individual’s expectations about another person or entity eventually result in the other person or entity acting in ways that confirm the expectations.

A classic example of a self-fulfilling prophecy is the bank failures during the Great Depression. Even banks on strong financial footing sometimes were driven to insolvency by bank runs. Often, if a false rumor started that the bank was insolvent (incapable of covering its deposits), a panic ensued, and depositors wanted to withdraw their money all at once before the bank’s cash ran out. When the bank could not cover all the withdrawals, it actually did become insolvent. Thus, an originally false belief led to its own fulfillment.

We live in a world full of narratives, that we are asked to believe without asking questions. Most common ones are “Covid19 jabs work as expected” or “climate will be so hot by 2100, it will be a great disaster”. Those making those prophecies have no capability to justify their statement, so they have engaged in a deception process, which they can no longer escape, or at the price of their future if any. For jab, it is easy to manipulate data, hide facts about adverse reactions, … For climate, you won’t be there to verify since you will have died from the jab long before!

Those who disagree with the official prophecies are nicknamed conspiracy theorists, which is the ultimate insult to stop any debate about any topic. Now, we can look at these conspiracies theorists prophecies, right? All that they have predicted for the last 18 months is happening even faster than they would have imagined: vaccination failures, lockdowns, blaming non vaccinated, future climate lockdown, forever pandemic, …. Self-fullfilling? No! With the help of internet, these guys are very well informed, and read quite well through the plans, which makes politicians nervous and forced to accelerate in vain attempt to take back control.

Here is one of those idiot:

J. Trudeau is an imbecile! He has taken away freedoms from the people for a ridiculous virus, freedoms that they fought to get over the centuries, and now he will only give them back only if they take a poison pill!

Here is my prophecy for Trudeau and alikes, when jabbed people will wake up. There will be no mercy!

Is It Inevitable? « Mark America

Climate warmists are no better, they try to spread fear and have started almost 20 years ago a narrative prophecy, whereby climate is changing fast due to human produced CO2. There is of course no proof of relationship between CO2 level and climate behavior. At time of dinausors, CO2 level was twelve times higher, the tree were gigantic size compared to today… but anyway, since people don’t ask questions, it is a good reason for future climatic lock down, where all data will be manipulated, there will be C02 passports, and who knows, maybe even CO2 vaccines!

Here is the key: ASK QUESTIONS! DON’T GIVE UP UNTIL YOU GET A FULLY JUSTIFIED ANSWER! No adverse reactions on vaccine? Show me the proof! You want report from hospitals! CO2 impacting temperature? Show me the corresponding studies, correlations over centuries, and show me data integrity!

Coming back to finance, Janet Yellen makes a prophecy of severe upcoming financial crisis if debt ceiling is not raised: rocketing intest rates, stock market crash. It is precisely BECAUSE of this debt ceiling raise THAT interests rate will eventually go up (hyper-inflation like) and that stock market will crash. Course n°1 or 2 in economics for dummies!

So again you should wonder and ASK QUESTIONS before the corrupted governments tries to dry your accounts because you are not jabbed, you have a car that is polluting too much CO2 and you have invested in stock markets, you little stupid!

Market Review

S&P is still in strong long term uptrend (above the blue river). There is a divergence (smoothed ROC second indicator) which points to possible trend change. Short term indicator at the bottom shows its third short signal in 3 months, which we can use for covering portfolio and more should market reverse).

Bitcoin is still up as well but you can see that bottom the short signal. Since we can not short Bitcoin, I am waiting for this short signal to reverse, might be the start of next move towards 75k$. Reason being US$ value going down as debt ceiling is raised. Philosophical question: is debt a currency? :-))

SOX (semi-conductor index) is important index to follow as it has some predicitive power. Semi-conductors are needed everywhere (for AI, 5G, …) so if sector is not looking good, expect some nasty wave on technology sector! What does it do? Slower than before but up! So my prediction is market crash is delayed! You can ask me questions, I will answer! :-))

Oil is flashing a buy signal. Not good if you need to refill your car tank but having stocks like OXY and you get a refund via stock price increase and good dividends! Do not forget electric cars together with wind farms and solar panels will just not work (you will be able to recharge your battery once a month at best and at huge price). Oil price will go up, same as CO2 explained last week! Get ready for it!

That’s it for today.

I might loose my job in the future in line with ‘no jab no job’ policy in my country. I will surely have plenty of time to write by then. You can support if you wish with BCH address:

qquemq7cq6swh80c3rp99dq7vs8547r6t58vc7eq0r

That’s it for today. Until next time, trade safely!

The boring market report April 7th 2021

The so-called pandemic continues to weigh on some parts of the world (e.g Europe) while some countries like US or Russia seem to see the light at the end of the tunnel! We will therefore continue to be driven by good news but also possibly by new lock-downs as politicians find it is convenient to keep people under control … until people awaken!

Bitcoin is still floating at high levels. Many expect a sharp correction to 40k or even lower, which is not impossible as can be seen in the short history of Bitcoin. Others still point at even higher targets.

I have been a bit too optimistic as can be seen from chart below:

After going through reaction line, there was just no resistance but the problem is volumes did not pick up immediately, resulting in this range bound market. As long as Bitcoin hovers over green average, no worries, I am not changing my position.

Tezos reached my objective almost on time, landing me a cool 40% profit! Nothing to be proud about that. Trade is not over, the volumes, as opposite to Bitcoin, are picking up and reactions lines will most likely be broken for further up move.

Nasdaq has resumed its uptrend in strong volumes. The new objective is 14130 points. A divergence with MACD histogram tends to confirm new all time highs are coming. Before going full speed, just spend some time a weekly chart below: no major correction since early 2020, plus a MACD with stratospheric value and a divergence with MACD histogram indicates some trend change in the future (remember it can be down or just an horizontal wandering)

I was kicked out of the Moderna trade for a small loss. What happened?

MRNA had made a bottom on orange reaction line (blue circle)and started an up move after down slopping the blue reaction line. Volume was low but I thought divergence MACD and its histogram would support me. Market thought otherwise, volumes did not pick up and MRNA even crashed the orange reaction line, which told me to get out even before my stop was triggered! See you on next reaction line, maybe…

That’s it for today. Until next time, trade safely!

Tezos – new departure to the moon?

I possibly mentioned Tezos earlier. Maybe I had not drawn the action and reaction lines. As can be seen from graph below, the trend is still up, Tezos has been taking some leisure time around the reaction line and seems to be going up again. You can draw triangles if you wish, but note there is no special scientific theory backing up such figures!

On the downtrend from 5$ to 3$, of course volume was big, it has decreased a lot but stays at high level. This is why we want to stay with the major trend which is up! Divergence between MACD and its histogram also points to same conclusion. The next reaction line is quite far away, objective could be reached by end of March if we are lucky and market is strong enough!

How do I play it?

I already have a position that I bought at 2$ (green arrow) and I halved it at 5$ (objective was 4.57$). New objective is 6.23$, 40% on top of current price with a stop at 3.70$. So I am buying half a position to restore one full line, half a line invested for as long as long term trend is up, the over half is trading to increase profits. The stop applies only to half my position.

That’s it. This is no recommendation of course. Until next time, trade safely.

Moderna – could the vaccine make your money?

Whether you are anti-VAX or not does not matter, money does not smell! Let’s look quickly at Moderna chart.

My system rings the bell, saying there might be an opportunity today. The 9-day average is point up, as well as the 48 which is still bullish. Only the blue 18-day is still showing negative slope.

The objective (drunkard theory) is 200$ and as can be seen from reaction line, there is zero resistance in the near future. Nothing seems to prevent reaching the objective. Stop of course at 126$

But wait? MRNA is down 7% today… it it? That’s good because distance to stop was big at close yesterday, meaning your position should be small, whereas today we can have either a bigger line or stay with small line but with a better risk/reward ratio!

This is no advice of course. This is how trading goes, we take the bet, and if we are stopped out, then it’s life, we cut the line and forget about MRNA.

That’s it. Until next time, trade safely!

Bitcoin: when is the story going to end?

Sorry I have been away for a few weeks to attend other businesses. I was also working on the future eBook which is not as easy as writing for a blog. There must balanced information, not too much to avoid overwhelm reader but enough anyway to kick curiosity and critical thinking! So should I write about inverted Laplace transform? Well answer is yes, but I need to make it simple for casual reader out there!

For this return I am going to talk only about Bitcoin, which has gone again over the roof. You may see everywhere Bitcoin is a gigantic bubble that will explode maybe tomorrow morning, leaving all of those with fortunes in Bitcoins … broke! Nothing can be further from truth, because as long as some countries tolerate Bitcoin as a concurrent to local currency somehow, those who forbid are also getting late on its technology and all the improvements it can bring in terms of security, cryptography, …

The ‘problem’ with Bitcoin lays probably with the price paid to miners which is halved every 4 years, and so Bitcoin price has to go up or the mining can not be profitable over the long term. That being said, price has only one direction over the long term: it is UP! Until it is pushed out forcefully by a better bitcoin….

Let’s look at the chart:

I have drawn the action-reaction lines, which is the only way to predict when and where the next top might take place. There is hidden symmetry in the market which you can see clearly, Bitcoin has been stopped by down slopping reaction line then wen through when many weak hands thought Bitcoin was going down back to 10k$.

There is almost zero resistance now until beginning of April. I expect the trend will be a bit slower. From exponential, coming back to parabolic more sustainable move is all we want!

That’s it! From now on, I will post some trading opportunities on some selected Nasdaq stocks with action-reactions line for your reading pleasure.

Until next time, trade safely!