How long does it take an average bloke to power on a light bulb?

You might think this post is about joking, maybe not so, but I will attempt to make you smile. We are living in a world that has gone insane because not only people are not thinking any more, but they also let others think on their behalf. As I have been advocating many times on this blog, thinking by yourself will let you see the light! Let’s go through many examples of current lunacy.

  • Let’s start with mainstream economists. They are usually the laughing stock of deep thinkers. Now they are telling us that debt, whatever the size, does not matter any more because the cost is so low that the interests needed to be paid back are smaller than 20 years ago. Yeah right! But are we not supposed to pay back the capital at some point? And what if interest rate go back up? (because they will!)
  • Ecologists are a cute little specie without brain and absolutely zero scientific or human psychology knowledge. They keep repeating what a group of idiots called Intergovernmental Panel on Climate Change (IPCC ) under United Nations Organization are saying. Those guys have established a correlation between CO2 level and Climate warming. It does not take long to look at raw data and see that this correlation does exist, but only from time to time! Data from last 20 years (average temperature has not gone up) is therefore ignored. Instead they claim that a 2°C increase by 2100 will be a total disaster for the planet (most of us will not be there to verify that claim anyway) and it legitimizes the attempt from Bill Gates to cool the climate by throwing chalk in the atmosphere, thereby …. choking (pun intended) in the process any existing life in that area. Totally insane. Why 2°C? Why not 1.5°C? or 3°C? Are oceans really going to immerse vast land areas (Archimedes would laugh at this idea!)? Relying on wind on solar energy only, will people accept to have electricity only during windy or sunny weather?
  • Green growth is also a chimera. Electric cars don’t do more than fuel powered cars, so when you switch to ‘green’, you create jobs for electrical car manufacturers but delete many more with traditional care makers. Negative impact again!
  • The pandemic and vaccine strategies clearly show how quickly our politician have reached burn out status due to smaller than average number of neurons in their brains! Imagine a vaccine based some technology born in the 1960’s but never approved for commercial usage, being suddenly approved for huge clinical trial…. It should make you wonder and investigate. The mRNA can modify your DNA. You are not eating transgenic wheat, right? And you want your genes to be modified without the knowledge of the impacts in 2 or 5 years? You are NOT a conspiracy theorist when asking questions, whatever they say!!

If you don’t know how to ask questions, go back to history and read old wisdom books. The old Chinese book ‘Tao Te Ching’ will definitely ignite brain power, then continue… there are thousands of books to read. You will also find that strong limbs, biceps, triceps, … muscles are best tools when coping with stress wherever it comes from, some Daoyin (Chinese) movements will help you think more clearly too! You may also humbly read again previous blog posts such as this one about challenging assumptions

How long will it take you to switch on the light bulb? That is the question!

You may end up with different conclusions, those are mine:

  • Dismantle those idiotic and useless organizations such as IPCC mentioned above, but also IMF, WHO, WEF, EU, … because they are led by insane people.
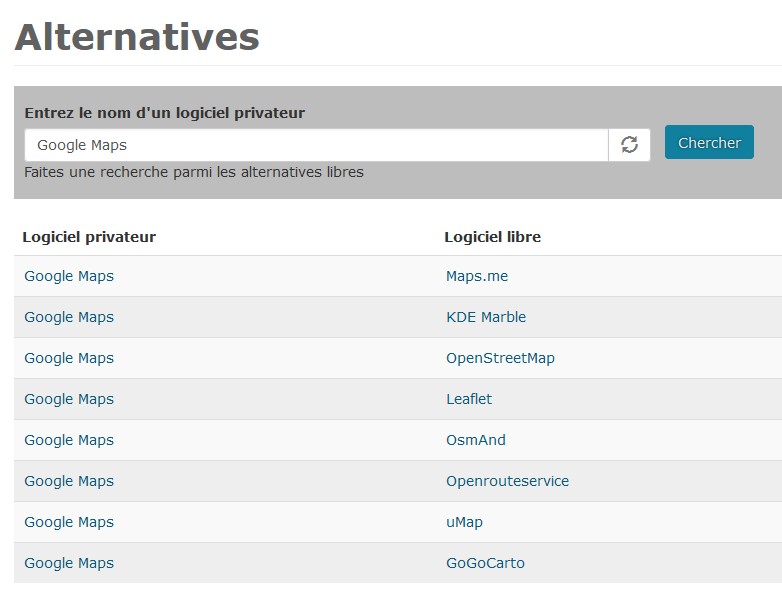
  • Dismantle Facebook and alike which make you waste your time without being paid back, and prevent you from thinking by yourself!
  • Spread sound culture, always get back to basis when needed. Have a good relationship with money
  • Prevent finance from playing with money or our savings. French Bank Societe Generale currently wants to issue a product made of a bond and an option, all secured by Tezos blockchain. When it all fails, they will blame crypto technology!!
  • <add your conclusions in the comments!>

Let’s finish this post by a look at Bitcoin chart. Yes Bitcoin is possibly a kind of Ponzi scheme where new entrants are paying for those who want to get out. But, by blaming Bitcoin and other crypto currencies, the crypto haters make buying opportunities for open minded traders who are trading, not investing in the long term (HODL). For as long as crypto’s are allowed, then there is profit to be made!

My red objective was reached (64891 vs 64808 calculated!) even before reaching the reaction line. Hidden Divergence with MACD, moving average still pointing north, and more than average volume points to a recovery in coming days but we have to be careful. Closure under 52k and I am out for the short term. On the longer term, I am out under 46k.

That’s it. Until next time, use your brains to trade safely!

Static versus dynamic, investing versus trading

In many of previous posts, I highlighted the necessity of asymmetric trading ie. a reward/ risk ratio that is as big as possible. Even in today’s very complicated markets, with millions of news per minutes, the random static trading model that I have shared is working beautifully. It is is static because it only based on an ‘observation’ period. The dynamic counterpart is about analyzing how a stock or index behave over an observation period with respect to a specific moving average, here we enter the realm of Laplacian distributions, too complicated to explain on a blog but the news is that I am progressing on my eBook writing and I plan to release it by end of the year! It will be extremely expensive but definitely worth it! Will prevent you being on the wrong side of markets!

Asymmetric investment is a totally different job. You don’t rely only on mathematics to make your decisions. You need to have a vision, anticipate what may happen, … Very few services are capable to do it! And you can see it through the performance of investments funds, most of them never beat index performance. Investing on index fund (what I call static) for next five ten years is probably the worst idea you may have these days. Economic crisis has barely started, though you already know for sure some good businesses that are now worth zero because they can not open to customers. So what should you do for long term? I can not help you too much here except recommend NoHypeInvest (click on picture!). I get no commission!

They share a lot of advice for free and if your portfolio is big enough, it is worth subscribing to their premium service. It is not for tender at heart, they are looking for 3 digits gains over a few years, even if they are true only 25% of the time. As explained earlier, this means you can have a long series of loosing trades, don’t blame them, you are warned! They are however capable to explain the key elements sustaining their reasoning.

Speaking of of vision, take a look at Chris’s forecasts for the coming years. Don’t say he is conspiracy theorist, and look at all laws being voted in your country and you will see he is right… unless we, folks, do something!

OK, man, but what are we doing? It is the same subject I called for you to think multiple times on this blog. Open your brains and don’t take every bit of news for granted. When you have a Facebook account, FB knows everything about you, even things you don’t know yet. Same for Google. They have started to decide what you can say, what you can not say, …. and they sell the data you have given for free for huge profits. So it is time to either leave or scramble their data and make it worthless: change you GPS positioning, address, name, encrypt data, … In Google database, I am weed and alcohol addict, looking at pink elephants in Sahara desert right now, which of courses gets me some hilarious advertisement!

Those looking for alternatives software or websites can look here for instance

That’s it. Until next time, trade safely!

The brainless society, the art of feeling nowhere at home

Philosophy and mathematics today for a change!

Should I mention Einstein, Laplace, Isaac Newton, … then you tell me these were geniuses of their time, with IQ far above average. They knew how to use their brains to solve some problems. Then maybe you would continue the list by quoting Warren Buffet, Bill Gates, Mark Zuckerberg? Right? Wrong! These are not geniuses. They are hard workers, use their brain to reach some objective, and have been helped by chance. A lot! They were at the right place at the right time to get money their way…

If you want to look at the work of an incredible brain without digging into formulas, you need to read that book. Author introduces a theory that Venus began as a brilliant comet ejected by Jupiter around 1600 BCE, wreaking chaos on Mars and Earth … For this objective, he has analyzed thousands of documents, we would call big data today, then produced a theory that unifies and matches all the stories shared until Roman empire at least. He may be wrong, but the attempt is definitely brilliant!

Let’s look now into the future! Who will be the brains of today that will be remembered in year 2500? They are called Deep Blue, Watson, Sequoia, Titan, MilkyWay-2, and their IQ are measured in Peta Flops, i.e. the number of operations they can make each second. The software on top of these super computers runs Artificial Intelligence algorithms, attempts to find repeated patterns in big huge amounts of data and appears intelligent because pattern from the past may produce similar results in the future.

Now imagine one second that such computer manages to prove that the straight line is not the shortest path between two points even in our euclidean space. Will you dispute this theory? Not a chance… Sooner or later, we will give up thinking and let the machines think for us. Sooner rather than later… look how advertisement pushes you to buy things you don’t need!

This is where we start having problems. Dividing the investment population (including robots) into bulls and bears is already very complex but completely pinpoints a divergent view between machines and humans. People are usually bearish or bullish on a stock, people change their mind, but if they have no opinion, they are not trading the stock. Bulls are bears can therefore be represented not by one but 2 exponential-like populations! If you are bull and suddenly express some concern, you are immediately flagged bear, but you can be drawn back to bulls territory in violent ways by hard facts. The exponential model fits that description.

For a machine, this is not possible. There is an average, and the deviation compared to average is measured. When average is positive, machine is bullish. but not in an exponential way. It is only parabolic, under the influence of Gauss theories. As explained in previous blog posts, population at the average is close to zero and some bulls and bears may feel totally not included in this model.

The Gaussian parabolic model is used everywhere where money is engaged. The Laplace first distribution exponential model (incidentally, the Gaussian distribution is Laplace second distribution, but history forgets) is barely used though it better describes nature and human behavior.

You don’t believe me? Let’s consider your life insurance. Your insurer has defined profiles, keeps asking question about family, your work, your habits, … and you are classified as profile that entitles you to benefits pending whether you are daredevil or living an hermit life. Too risky or too safe is suspicious. The Gaussian curve averages it all, including the extra small font section in your contract, and when you think you could profit, you are just outside the dotted red parabolic curve! From another perspective, if you fit exactly the average, you are probably lying or are the boring kind.

Not everything can be fitted into Gaussian distributions. If you are managing a company designing products, you know you should focus your efforts on features that leave the competition behind. But spreading the budget in Gaussian manner across projects may be a very bad strategy, putting too much stress on critical matters. The spreading should look like this graph!

Pierre Simon de Laplace is still heralded a genius by many, including me. He has worked 2 distributions, one is akin to industrial processes (the parabolic one promoted by Gauss) and works perfectly for that purpose, the second one is a better fit for nature and human behavior. There may be still others…. Being in the wrong model makes you by default outside your own model and you don’t feel good at home! So wake up your brains, we need the world to be a safer place, we have enough to cope with cataclysms and pandemics and we want to have theories, disputes, …. because that is life!

Pierre Simon de Laplace

That’s it. Until next time, trade safely!

Are the markets efficient?

It is a theory that has been in the air for quite long time that says that the price at any time reflect all the information available to investors.

Read again what I have just written!

How can this be true? what is the fair price of a security with all information available? Is there any magic formula for this? And why would it be valid for every one and all the time? Why does the price keep changing every day?

True enough, there are organizations (banks, Hedge funds, …) that have implemented in their system a formula based on statistical analysis. The inputs are usually price earnings ratio, price to book value, … and a few dozens others like ‘is surprise earning having any significant impact on price?’. Then they analyze real-time(!) all the information available in media, social networks, … and compute a ‘fair’ price, decide whether the security is under-priced and then they take position. Not on a daily or weekly chart! No on a 3-minutes chart! Because competition is sharp, they come up with same conclusions, and prices usually catch this fair price in a couple of hours. Risk is very limited for them! And so markets are efficient from this perspective.

For the average investor, unfortunately, this does not work unless you can buy yourself one mainframe computer and have programming skills and can analyze big data.

But markets are still moving in other time frames! Because price is made of the opinion of huge number of investors, be they humans or robots or martians, … and nobody thinks exactly like his neighbor. Reasons are linked to the security itself or external, e.g. you need cash to buy yourself a coffee! The result of this processing can only be random and you would be right questioning the market efficiency. I have proven in previous article that trends emerge out this random process and that is one of the best way to make money and beat the market!

So have fun with random processes, dig in whatever good books exist on the subject.

Why you need to master probabilities…

Everybody hated probabilities in high school. The exercises like a bag with 20 red balls and 30 black balls, draw 2, what is the probability of having 2 black balls?

Trading is managing your luck at playing with a system that is random, and any forecast you make has non-zero chance to be wrong! In other words, you are not trading the market, you are trading a belief that the market will go (or continue to go) in one direction for some time to make profits. You must not leave that to anyone having no interest in probabilities.

Take the example of weather. You are not asking climatologist about the weather next week. Climatologists focus on long term climate change and whatever happens in the weeks or even months is insignificant; in other words it is noise! Meteorologists, on the opposite, are concerned by the short term, they have made a model in which they believe, after having tested many weather conditions and they bet on something likely to happen, e.g. sunny weather, and sell this information to their customers. You know weather forecasts are never perfect but they are improving as more and more data and computing power is made available to them!

Same goes with trading. Economists are interested in long term economic cycles (Kondratieff, …) and so their comments on many TV channels why S&P500 is up 0.5% because (un)employment shows an increase of 0.3%. Not only is 0.5% up or down on market index is noise, but there is surely no correlation at all, if you would look at data from the past.

Traders main interest should and must be how to have a system that can say with a level of certainty where the market is going in the short term. The model the trader is using should have a positive expectation, i.e. being profitable over long periods.

Yes, but sometime, the weather is sunny for very long time, and nothing happens? Correct! And for trader, it is the same. When market is too quiet or too much random (like it is now), trader must refrain from trading and risk blowing up his account

Trade safely, use stops, and don’t forget to wash your hands!

The foundation post: fooled by the market … and your brain!

Previous title: Markets are correcting, aren’t they?

Sorry I have not written for a while. Thank you very much for your encouraging comments. Yes it is true, luck is an important factor in trading and it needs to be factored in when working on any trading strategy. The question is always the same: how do you manage the unknown? The fact is that when the brain has seen something, which we may call a pattern, it is looking for evidence that it is there and reveal something. We are not accustomed at at all to challenge the existence of pattern.

Let’s take an example. Here is a list of numbers: 2 , 4, 6. What is coming next?

Most likely you are going to say 8, right?

In fact, had you answered 25 it would have been an ok answer because I only about 3 consecutive higher numbers. No other rules.

When you see a pattern next time on a chart, take time to challenge it!

Now let’s look at S&P500 and recent price action.

You do not need 20 indicators. A ROC-L (created by Alexander Elder – it is a ROC 21 days applied to 13 days exponential moving average) is good enough, quite smooth. There was a divergence on the top and signal to sell was there (red color)

That’s it. I am not looking for any other confirmation. Market has been on a long streak of winning weeks. Whatever the reason (Fed printing money by billions, or chinese virus, …), the market was bound for some other direction.

I explained previously (did I?) that the market is statistically NOT a normal distribution so don’t rely on Bollinger bands to anticipate. We are much better off with action-reactions lines (the big idea behind Andrew Pitchfork) because if prices have gone away from center line in one direction, then it is likely they will do so on the other side. Concept is simple, the secret is where to draw the center line. I need to write a book about this, since Andrew never went to such details.

So finance suddenly realizing impact of Covid-19, prices have dropped in 2 days to their second reaction line. The 2 lines below close to each other should prove a better support.

Let’s be clear, we are bearish now, with something that looks like the beginning of a bearish short term trend. I can change my mind above 3300, this number will of course go down in coming days. On a longer term basis, the bullish trend is of course still valid as long as above 3100 on weekly chart, and 2840 on monthly chart.

Due to the weight of index based ETF’s, it does not make too much sense to look for opportunities on major stock. But volume might be small on small caps making trading also risky.

Until next time, trade safely.

Winning streak? It is all in the figures!

Here we go for a technical discussion today. We have all heard that markets are more or less random, as it represents the opinions of millions of investors or traders, and of course, they don’t usually agree with each other, the proof is that there seems to be always some who wants to sell you some stuff when you want to buy it.

So prices may look random but there is a positive bias because prices can not be negative. So normal curve distribution is not applicable. See when Bollinger bands go into negative territory, you know the objective is invalid!

So let’s assume for the exercise that we have a 55% chance that tomorrow price will be higher than today, so 45% risk they are lower. What is longest series of positive consecutive days?

Any idea?

Hint:  we need to use the law of large numbers.

The formula is:

-ln(number of observations)/ln(probability)

So the longest streak of consecutive winning days for 100000 days observed is -ln(10000)/ln(.55) = 19 days and same calculation yields a 14 consecutive loosing days.

Yes, that is what swing trading is about. Anticipate these streaks of consecutive winning or loosing days and play them accordingly.

The same goes with goes with your trading strategy. The probability lays in your own skills to define a winning system. You need to backtest with as much data as possible. A system that is winning 85% of the time can still yield 6 consecutive loosing trade (but also 70 consecutive winning trades ;-))

What happens with robots trading? There are 2 points to consider:

1. Robots have been programmed by human. So they just replicate our trading strategy. So same as above applies

2. Robots can be taught to learn (machine learning, neural networks). After some time they will all more or less reach the same strategy and so they will ‘see’ same thing, so market will become flat and cancel out robot trading efficiency if any.  Some news (real or fake) will be needed to move the market. Robots will learn to cheat and will need support from humans!

So as conclusion, you need a strategy with an edge to catch swings or trends, they are predicted by the random nature of the market. You can protect your strategy by:

1. Not sharing it. Keep it secret.

2. incorporate elements that can’t be automated (e.g. action-reaction lines)

3. Incorporate strong psychological elements. Trend traders for instance do not have more than 30% success rate for their trades. Meaning they may have to endure 32 loosing trades in a row! Without excellent money management and psychological force to endure this, you blow out your portfolio and yourself in no time! But you can also catch the huge moves!

With volatility trading, I can reach 60% success rate on trades, so easier to stand psychologically, up to 85% in very volatile markets.

Until next time, trade safely

The hidden beauty of volatility bands?

You may have wondered why in previous post I talked about action-reaction lines for trading. This is very technical and manual but the principle will be re-used.

Volatilty bands do already exist. There are Bollinger bands (based on standard deviations) or Keltner bands (based on ATR). Is that it?

No someone created also the ‘better Bollinger bands’ (sic). See some code here: https://www.prorealcode.com/prorealtime-indicators/better-bollinger-bands/

Volatility still is little explored. You know when you are on the right path when it becomes simple.

Look at those bands. If green, go long! (Consider long term trend of course)

This one is even more fun. Formula is deceptively simple. And there seems to be linearity in the market!!! Of course, humans think in straight lines! Just follow them and trading becomes profitable

Apple Weekly

Until next time, trade safely

Can you anticipate market direction?

If there is field relatively unexplored, it is volatility. Because you need to throw away the gaussian curve and look the market in the eyes. Obviously you can what it is doing just now, but do you know where it goes?

Most traders have given up on forecasting, they are merely following the trends. But we are talking human perception and analysis. As many studies have show, human mind decisions can be anticipated with some success and that that should be enough to get an edge.

Let’s start. Here you can see price of gold in € some time ago. Do not worry about multiple lines already displayed. A green arrow indicates there should be some buying opportunity. So?

Let’s go back a little bit and and look at the waves.

Now if you patient engouh, look into Dr Andrew, creator of pitchfork and browse to action-reaction lines. Now the fun begins. Pitchforks and reactions lines by extent capture trend and volatility at the same time. As strange as it seems, volatility can be anticipated. Of course, you know quaterly results date, right? So you expect some move. Acttion-Reaction (AR) lines do anticipate this.

Let’s trace the center line (you need research to be able to find which one is best). Then trace the AR lines.

The space between the lines is volatility in 2-dimensional space: time and price!

According to theory, price should stop on one of the next reactions lines

Fast forward in time!

First line is ignored by market. Then we get  tops on reaction lines. Not just one time but twice!

Wonderful!

Trade safely until next time

Why you need to love volatility

You probably have read in many places that volatility is a monster that will eat your portfolio.

Let’s start from zero: volatility over a year is how much price have in whatever direction.

Now look at this one:

Price have risen from 10€ to 20€ in an  almost straight line. So volatility is roughly 100% and you don’t want to be in? No kidding!

Next time we will see how to observe volatility and how it evolves to a trend.

Trade safely