Relative Strength Index: weaknesses exposed

Today we will take a quick look at most popular, most used indicator, but I have never understood why traders give it such value! Let me give you some tips to make it interesting. We are going to use Facebook for our study!

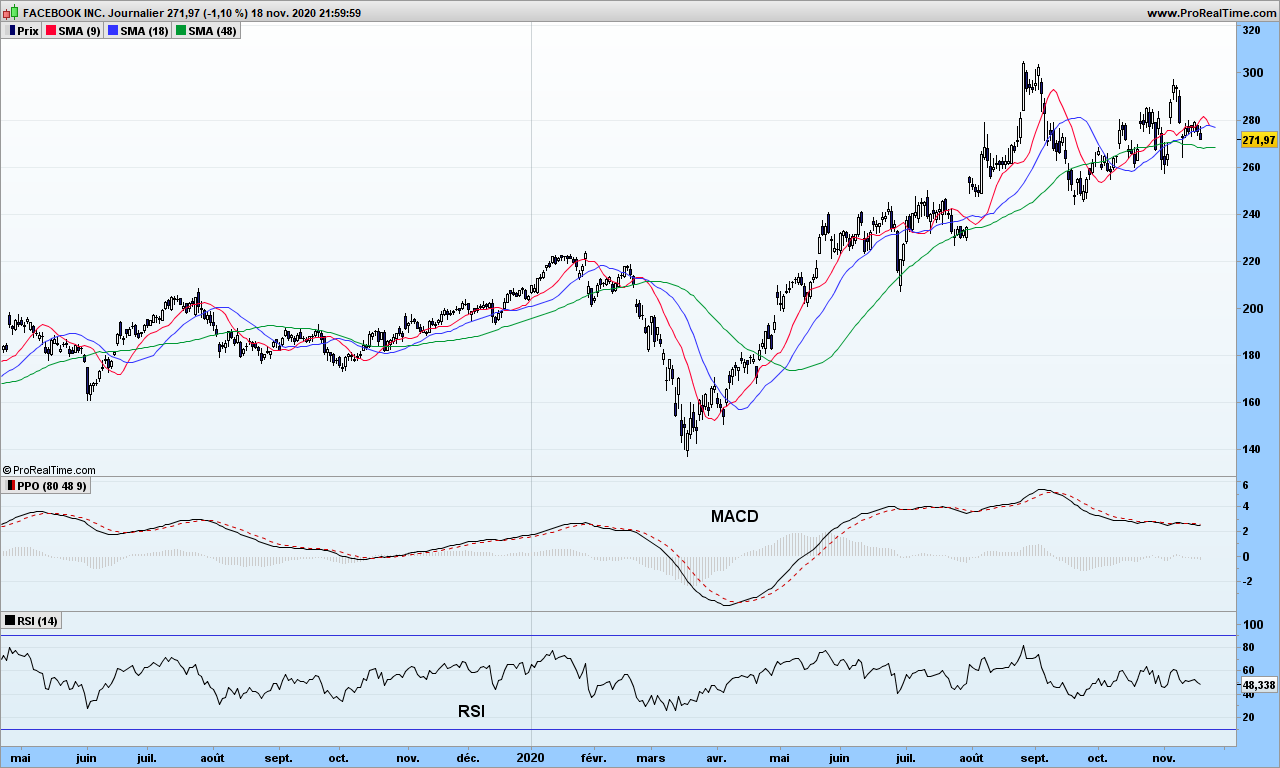
On the graph, you can see RSI indicator at the bottom, just below our customized MACD. It looks very noisy especially with default parameter 14, but since it is an oscillator (as opposed to trend indicator that MACD is), you may spot better synchronization with market tops and bottoms. If you can’t see, move your seat away from your screen, a bit more, even more… can see now? Good… The blue lines indicate the overbought and oversold levels, which, as you can see, are not reached very often!

So what’s wrong? The problem lies in RSI formula:

RSI = U / (U + D) where U is average of up moves in last n days, and D average of down moves over same period.

As I have previously demonstrated, market is a random and existence of trends is the proof of its randomness. So where is the link between this formula and random nature of market? The calculation could give similar results whether all the up days are consecutive or not, so with totally different market configurations. So, yes, it may work if you are very short term trader (a few days at most) and work out the divergences, market tops and bottoms, and decide what to do about it.

Could we modify it for more interesting usage? Of course! We can even use it for trend trading. Just replace delta between today’s and yesterday’s close by the delta measurement on your favorite moving average!

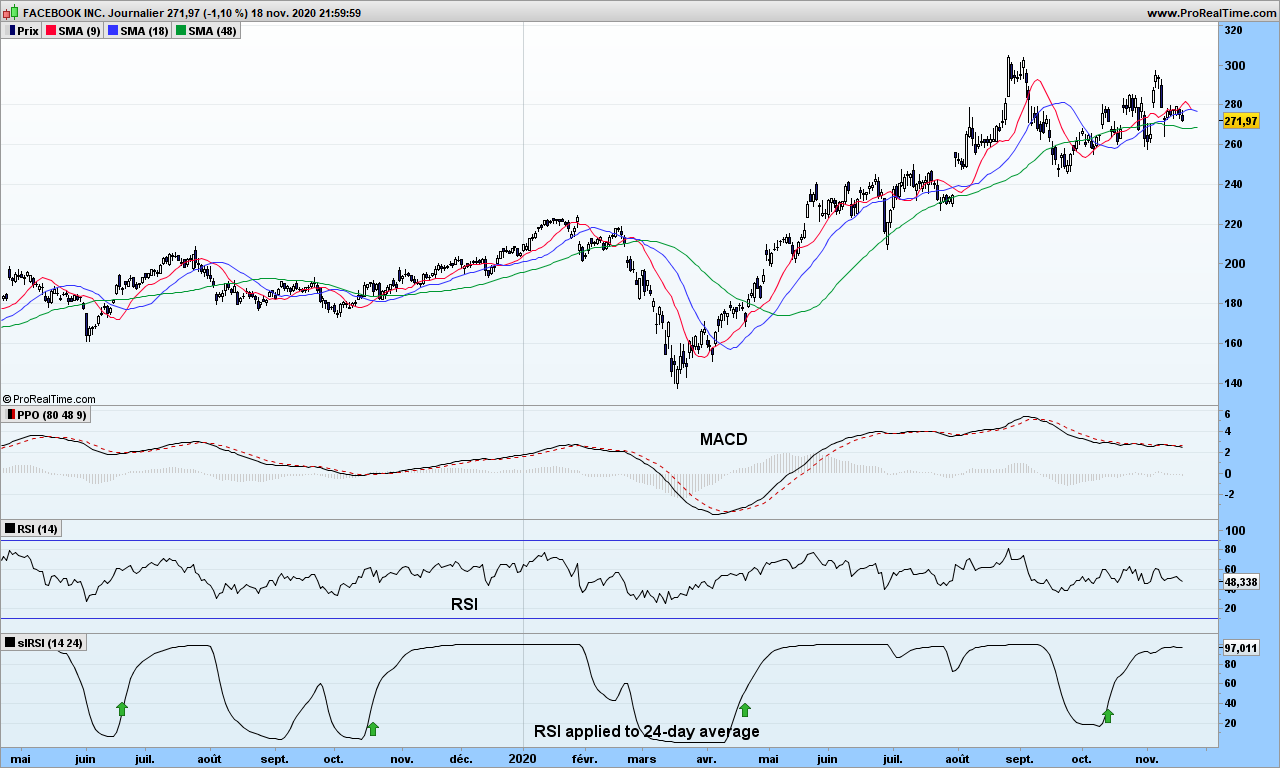
Now look at this new indicator. Buy signal is generated when improved RSI (iRSI) crosses above 50. You will notice it goes straight to 100 and stays then there until exit time. Easy, isn’t it?

As usual, use a stop to secure your gains. You may also define overbought and oversold areas at +30 and +70 if you want to stay with the trend as long as possible. False signal do exist of course, and there are 2 on the graph; the moving averages tell you not to go!

That’s it. Until next time, trade safely!

The way to find an edge… a mix of math and philosophy

This post will not be technical at all, only food for the mind!

There are many brilliant brains throughout history and also many people who have had more luck than anyone else. Think of our dear Warren Buffet or even Bill Gates. If they had not been in the right place at the right time, they could have had totally different destinies! So was it luck or was it intelligence or both? Imagine one second that our computers could run OS/2 version 2020 operating system…

Finding an edge is key for trading, as your trading system needs to have a positive expectation if you want to be profitable over the long term. I have uncovered many edges in this blog that have been there for long, and will stay for long as it is unlikely that finance will change their model for a long time.

Now look at recent history: a small tiny virus has pushed many companies over the edge, pun intended! Finance is everywhere in each company, be it business case, cost tracking, profitability analysis, … and what? Companies are so weak, that a virus throws them off board?

The truth is more simple. The bosses are all trained in same business schools, applying same models without thinking about their validity. Role of chance is totally underestimated in their career, they think they manage successfully and will write books about it. Nothing is further from truth.

Finding a robust edge is key to your trading career. Most of those published on this blog can land you in positive territory but this is just the start. You need to work on your own edge, by finding new ones or improving those shared here. You do not need mathematics or philosophy to start with. Use these approaches only to confirm your theory. Honesty is also key: do not look for confirmations that your system is working, look at the cases where it does not work and find the reasons. Exactly what business schools are denying to do, because, should they do it, they would have to close their doors!

My latest trading strategy, which I can’t share of course, has found recently the mathematical confirmation I was looking for: Laplace first law of errors, created in 18th century! The second law of Laplace, also called Laplace-Gauss is the one used by finance in spite of its non applicability. The performance of the system is beyond all expectations… Laplace was a genius! Henri Poincaré is an other one of my favorites. Do you know them? H. Poincaré had identified the relativity before Einstein, who was only better at marketing it!

Henri Poincaré

Volatility Trading System superior performance

I wrote in some previous posts that volatility trading improves the performance of any trading system. Is it the case? Really? How better is it?

The goal of volatility analysis is to get rid of loosing trades as much as possible, so if you go from 30% winning rate to 60%, then number of consecutive loosing trades will be narrowed down, the overall profitability will increase.

Let’s start this demonstration with a simple yet very interesting trading system:

  1. Buy when close > SMA(9)(close) > SMA(18)(close) > SMA(50)(close)
  2. Get out of the market when close is crossing under the SMA9

Close is today’s closing price, so you buy at the opening the next day. SMA(x) are x days simple moving averages. I am not taking short positions for this exercice, the rules would be exactly opposite.

Here is the graph of Apple over last few months. The 3 moving averages are shown by red (9 days), green (18 days) and blue (50 days) color. Some entries are shown with green arrows and selling the position by red crosses.

Looks good, doesn’t it? As long as the stock is capable to trend and Apple perfectly fits this criteria, this trend trading system should be ok.

Let’s now run a systematic simulation for a portfolio (10k$) with only one line and re-invest 100% of the profits. Here is the result:

Over 20 years, you multiplied your capital by 8! Great 🙂

But a few considerations are needed:

  • A buy&hold strategy would have yielded much more (x18)
  • you get 35% winning trades, a win/loss ratio of 1.67, biggest gain is 14257$, largest loss is 6226$
  • As expected from calculation in previous post, we can get a series 12 loosing trades in a row

Psychologically it is tough to handle, but could be worse. If you traded Cisco instead of Apple, the result is negative! That is because volatility is not big enough!

Now if you traded Bitcoin with this system, you are a billionaire! See the graph and report just below! Notice an almost 300M$ loosing trade, that is undoubtedly hard on the psychology!

Now I am adding volatility control on Apple, on top of previous one:

See? Now we multiply our initial capital by 41 (started from 100k$), beating by far buy&hold strategy! Now we get 68% winning trades, a win/loss ratio of 3.77, max 7 consecutive loosing trades but 16 long series winning trades 🙂

That’s it for today! Until next time, trade safely!