The way to find an edge… a mix of math and philosophy

This post will not be technical at all, only food for the mind!

There are many brilliant brains throughout history and also many people who have had more luck than anyone else. Think of our dear Warren Buffet or even Bill Gates. If they had not been in the right place at the right time, they could have had totally different destinies! So was it luck or was it intelligence or both? Imagine one second that our computers could run OS/2 version 2020 operating system…

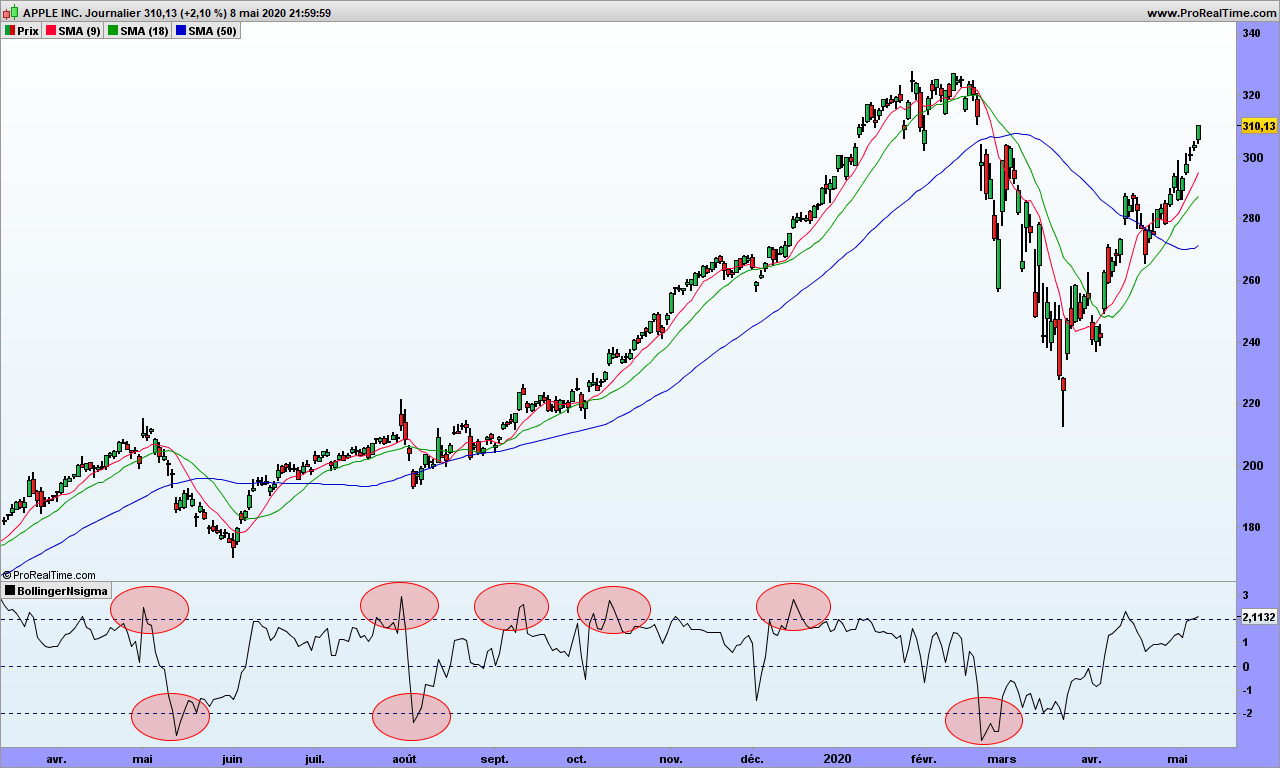
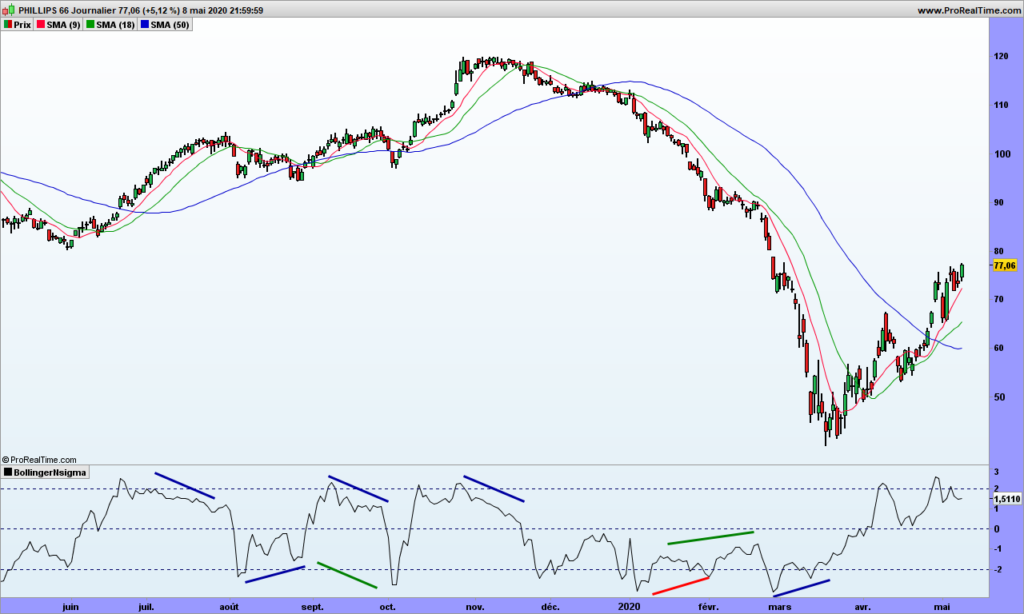
Finding an edge is key for trading, as your trading system needs to have a positive expectation if you want to be profitable over the long term. I have uncovered many edges in this blog that have been there for long, and will stay for long as it is unlikely that finance will change their model for a long time.

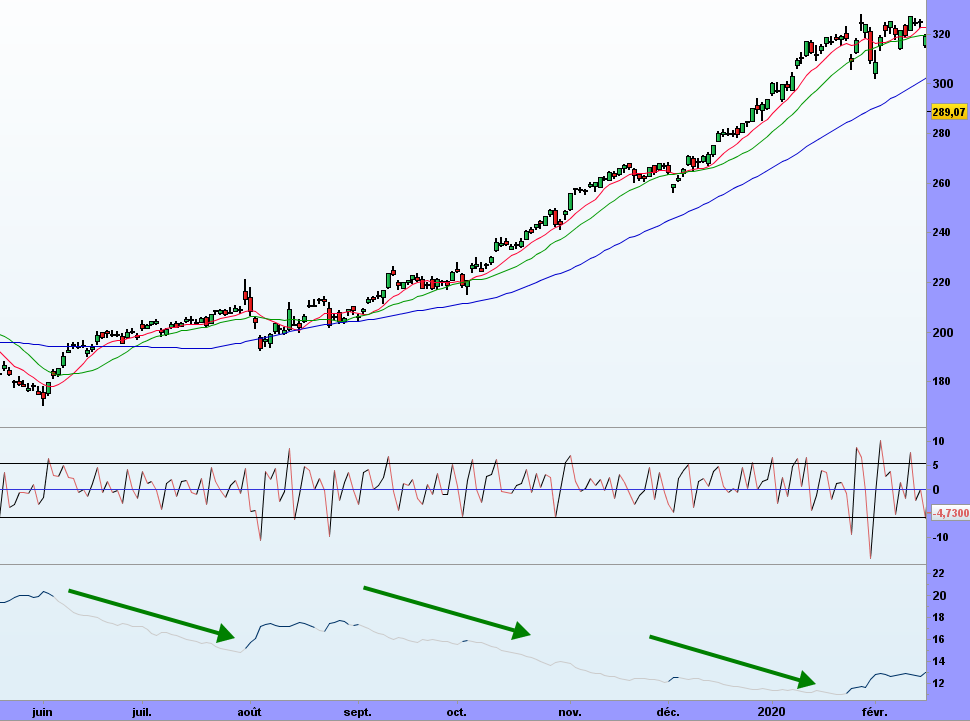
Now look at recent history: a small tiny virus has pushed many companies over the edge, pun intended! Finance is everywhere in each company, be it business case, cost tracking, profitability analysis, … and what? Companies are so weak, that a virus throws them off board?

The truth is more simple. The bosses are all trained in same business schools, applying same models without thinking about their validity. Role of chance is totally underestimated in their career, they think they manage successfully and will write books about it. Nothing is further from truth.

Finding a robust edge is key to your trading career. Most of those published on this blog can land you in positive territory but this is just the start. You need to work on your own edge, by finding new ones or improving those shared here. You do not need mathematics or philosophy to start with. Use these approaches only to confirm your theory. Honesty is also key: do not look for confirmations that your system is working, look at the cases where it does not work and find the reasons. Exactly what business schools are denying to do, because, should they do it, they would have to close their doors!

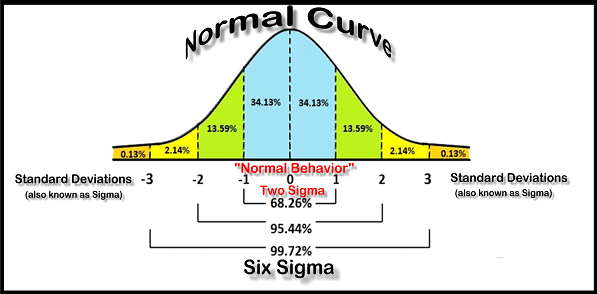
My latest trading strategy, which I can’t share of course, has found recently the mathematical confirmation I was looking for: Laplace first law of errors, created in 18th century! The second law of Laplace, also called Laplace-Gauss is the one used by finance in spite of its non applicability. The performance of the system is beyond all expectations… Laplace was a genius! Henri Poincaré is an other one of my favorites. Do you know them? H. Poincaré had identified the relativity before Einstein, who was only better at marketing it!

Henri Poincaré

Bollinger bands from a different perpective

As a blog about volatility, of course, there must be a post about Bollinger bands, which is the most common way to assess volatility. More especially, finance have based all their systems, assuming that prices are a Gaussian distribution (aka bell curve).

If this statement was true, then only 2.14% of prices should be outside the 2 standard deviations (aka sigmas). For one year, say 200 days, 4 days should be oversold or overbought, as commonly said!

Fair enough, let’s work a quick indicator that tells us how many sigmas the prices are from the average. We are taking John Bollinger’s definition.

Indicator = (close – 20-days average of closing prices) / Standard deviation 20 days

Let’s look again at Apple graph over last few months!

We have gone beyond the 2 standard deviation at least 8 times, sometimes for a few days. It is not looking good! If you are looking at S&P500, it reaches -3 sigmas once a year at least, when it should be the case more or less once every 8 years. Of course, it is probabilities, and this can happen more often. Correct, but there should be also long years without this far reaching. Which is not the case!

Now that you have spotted this interesting paradox, you have a new edge for trading! The best to trade Bollinger bands is just to NOT draw them. Remember that bubbles and parallels pointed by by Bollinger specialists are mere illusions!

Instead use our small indicator!

The indicator displays many divergences:

  • Blue ones are standard divergences with the price to spot reversal
  • Green ones show hidden divergences in the direction of the trend

I have highlighted a red one to show one that did not work. Be careful, if the trend is strong, wait for a signal to profit by the divergence, at least let the price go over the short moving average.

See, it is easy! For standard divergences, make sure first point is in oversold or overbought area, as indicated by the 2 sigmas lines.

One you are in, don’t get out of your trade at the 20-days moving average (strategy called ‘return to mean’), use a trailing stop, the green average for instance.

That’s it. Some people would charge you 5000$ per year to then send you the signals by email. If you do sell this service, please remember my commission!

A deep dive into volatility trading – part 2

Everyone has different ideas about what volatility is, what it measures and how to use it (when it is known!). Volatility is a measure of speed, a measure of risk, a measure of objective (see my posts about random walk), a measure of noise, a measure of whatever your imagination lets you think of providing you can link it to some facts. Remember that volatility is just a number and trying to fit in a box will lead to misunderstanding of other boxes that the number may fit in an other dimension.

Volatility is usually calculated by means of variance and standard deviation, but this assumes market is a Gaussian distribution and prices almost never err beyond 3 standard deviations (once every 34 years to be accurate) but THAT IS NOT THE CASE! Price goes beyond 3 standard deviations at least 3 times a year on indexes and individual stocks. The model is wrong but all financial tools (options, warrants, …) are based on that and, as surprising as it may seem, it gives us an edge to play against finance.

If you have observed the 1-day momentum in part 1, some bells should have started to ring. Let’s look at an other one:

Look at momentum value! Most of the time they are contained within a specific range. Exceptions are results announcements or market corrections. Don’t you find it strange?

Think about this. You want to buy a small flat, 35 square meters, seller wants 40k€. You being budget conscious, you may propose 39.5k€, saving some money to refresh the kitchen. You propose 500€ below the asked price. It may work!

Second situation: you are now buy a condominium 800 square meters, seller wants 4.7M$. Now you make a bid at 4 699 500$, or 500$ below the asked price. This is mean (in the sense of contemptible!). Now only will the seller think you are kind of psycho or moronic psycho, but you are clearly at risk of not getting the flat, which is pretty bad if you think flat price may go up 30% in next 10 years!

Now look at Apple graph again. Negotiations are in the same range, whether Apple is priced at the 200$ or 300$!

Once you have observed this, you know YOU HAVE AN EDGE!

There are many reasons why this happens. Sure enough HFT (High Frequency Traders) are playing with 0.01€ variations and they have volumes to play with. But think also about a call warrant: price goes up if price of associated stock goes up, but it is driven down by expiration time AND lower volatility. Get it? Finance has an edge!

The rules for volatility trading are thus this simple:

  • Buy when volatility is high and going down
  • Short when volatility is low and going up

Without disclosing the (smoothing) formula, let’s look at a volatility indicator that makes sense (bottom of the graph). Volatility goes down when prices climb up and volatility increases when the market hiccups giving opportunity to buy with very good timing!

That’s it! Because I am not using a predefined model to fit in the data, the data speaks back to me! Until next time, trade safely!