
Everyone has different ideas about what volatility is, what it measures and how to use it (when it is known!). Volatility is a measure of speed, a measure of risk, a measure of objective (see my posts about random walk), a measure of noise, a measure of whatever your imagination lets you think of providing you can link it to some facts. Remember that volatility is just a number and trying to fit in a box will lead to misunderstanding of other boxes that the number may fit in an other dimension.
Volatility is usually calculated by means of variance and standard deviation, but this assumes market is a Gaussian distribution and prices almost never err beyond 3 standard deviations (once every 34 years to be accurate) but THAT IS NOT THE CASE! Price goes beyond 3 standard deviations at least 3 times a year on indexes and individual stocks. The model is wrong but all financial tools (options, warrants, …) are based on that and, as surprising as it may seem, it gives us an edge to play against finance.
If you have observed the 1-day momentum in part 1, some bells should have started to ring. Let’s look at an other one:
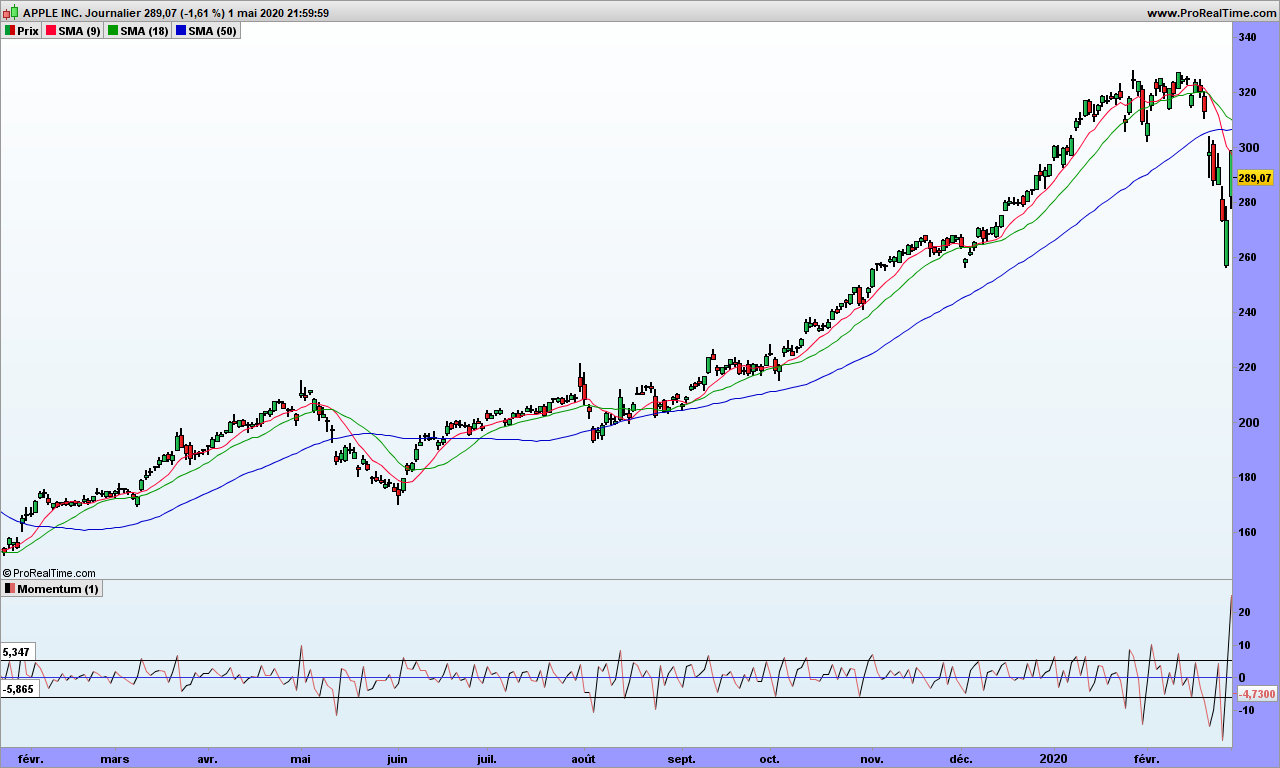
Look at momentum value! Most of the time they are contained within a specific range. Exceptions are results announcements or market corrections. Don’t you find it strange?
Think about this. You want to buy a small flat, 35 square meters, seller wants 40k€. You being budget conscious, you may propose 39.5k€, saving some money to refresh the kitchen. You propose 500€ below the asked price. It may work!
Second situation: you are now buy a condominium 800 square meters, seller wants 4.7M$. Now you make a bid at 4 699 500$, or 500$ below the asked price. This is mean (in the sense of contemptible!). Now only will the seller think you are kind of psycho or moronic psycho, but you are clearly at risk of not getting the flat, which is pretty bad if you think flat price may go up 30% in next 10 years!
Now look at Apple graph again. Negotiations are in the same range, whether Apple is priced at the 200$ or 300$!
Once you have observed this, you know YOU HAVE AN EDGE!
There are many reasons why this happens. Sure enough HFT (High Frequency Traders) are playing with 0.01€ variations and they have volumes to play with. But think also about a call warrant: price goes up if price of associated stock goes up, but it is driven down by expiration time AND lower volatility. Get it? Finance has an edge!
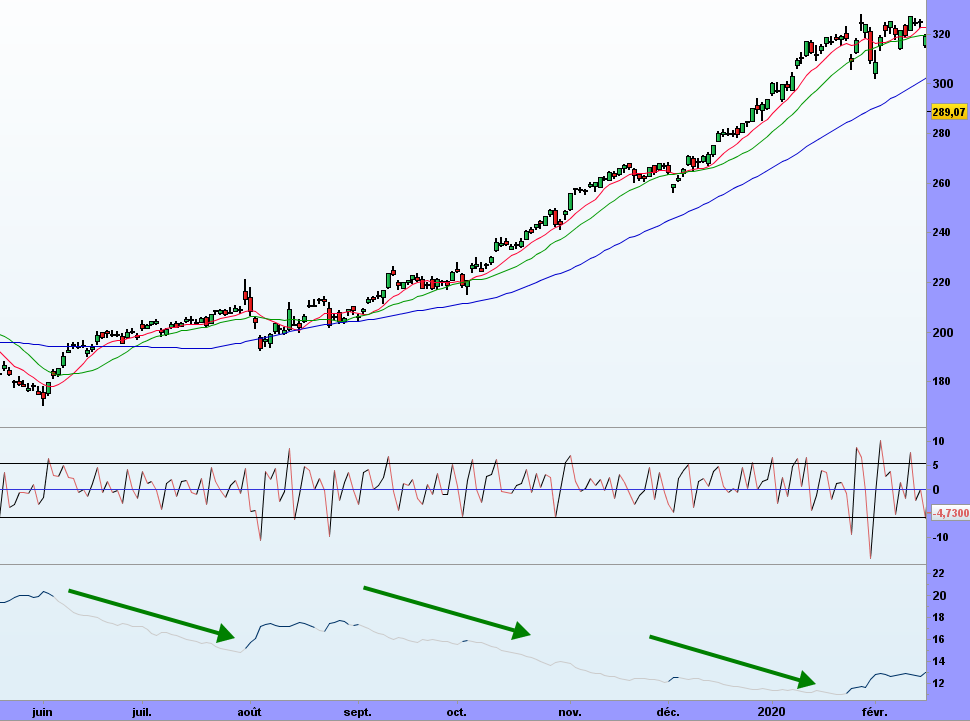
The rules for volatility trading are thus this simple:
- Buy when volatility is high and going down
- Short when volatility is low and going up
Without disclosing the (smoothing) formula, let’s look at a volatility indicator that makes sense (bottom of the graph). Volatility goes down when prices climb up and volatility increases when the market hiccups giving opportunity to buy with very good timing!
That’s it! Because I am not using a predefined model to fit in the data, the data speaks back to me! Until next time, trade safely!
I enjoyed your post. Thank you. You’ve made my day! Thx again. This is an excellent, an eye-opener for sure! I really like your article.
I think this is a real great article.Much thanks again. Want more.
I think this is a real great article post.Thanks Again. Really Great.
Amazing Some extremely valid points! I appreciate you penning this article and also the rest of the website is also really good.
Great read. i am huge fan of and . Thanks for writing this.
Thanks for sharing, this is a fantastic article post.Really looking forward to read more. Fantastic.
I cannot thank you enough for the article post.Really thank you! Fantastic.
I really enjoy the article.Really looking forward to read more.
I really like your article. Nice write up. I really like your article. You are obviously very knowledgeable.
Very neat article post.Thanks Again. Really Cool.
Very good blog.Really thank you! Great.
Thank you ever so for you article post.Really looking forward to read more. Cool.
Im obliged for the blog article. Want more.
Thanks again for the blog article.Much thanks again. Really Cool.
Really enjoyed this blog article.Much thanks again. Much obliged.
Great article post. Awesome.
I truly appreciate this blog post. Will read on…
I cannot thank you enough for the article.Much thanks again. Great.
This is one awesome blog post. Really Cool.
I really like and appreciate your article post.Much thanks again. Really Cool.
Muchos Gracias for your blog post.Much thanks again. Really Cool.
Say, you got a nice blog post.Really thank you! Keep writing.
Major thanks for the blog article.Thanks Again. Really Cool.
Muchos Gracias for your blog article.Much thanks again. Will read on…
This is one awesome post. Really Great.
Very informative blog article.Really looking forward to read more. Really Cool.
Thanks so much for the blog.Really looking forward to read more. Awesome.
I always spent my half an hour to read this web site’s articles or reviews daily along with a mug of coffee.
Thanks so much for the blog article. Great.
Thanks so much for the article post.Really looking forward to read more. Much obliged.
Thanks for the article.Thanks Again. Will read on…
Appreciate you sharing, great post.Thanks Again. Cool.
Thank you for your article.Thanks Again. Awesome.
Thanks a lot for the blog article.Really thank you! Fantastic.
Muchos Gracias for your post.Thanks Again. Much obliged.
Thanks for the post. Really Great.
I cannot thank you enough for the article post.Really thank you! Great.
I really enjoy the article post.Really looking forward to read more. Keep writing.
Very informative article post.Really looking forward to read more. Really Great.
Muchos Gracias for your article post.Much thanks again. Really Cool.
Thank you for your post.Thanks Again. Really Great.
Awesome blog article.Thanks Again.
Thanks so much for the blog article.Really looking forward to read more. Great.
Say, you got a nice blog article.Really thank you! Really Cool.
I learn something new and challenging on blogs I stumbleupon everyday.
Like!! Thank you for publishing this awesome article.