
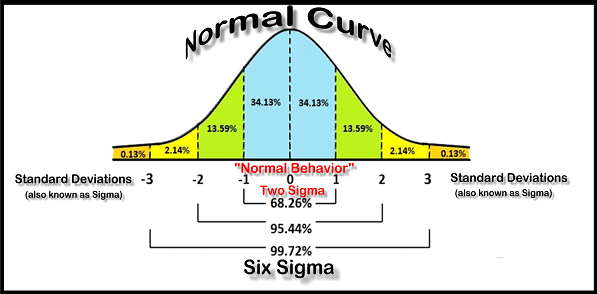
As a blog about volatility, of course, there must be a post about Bollinger bands, which is the most common way to assess volatility. More especially, finance have based all their systems, assuming that prices are a Gaussian distribution (aka bell curve).
If this statement was true, then only 2.14% of prices should be outside the 2 standard deviations (aka sigmas). For one year, say 200 days, 4 days should be oversold or overbought, as commonly said!
Fair enough, let’s work a quick indicator that tells us how many sigmas the prices are from the average. We are taking John Bollinger’s definition.
Indicator = (close – 20-days average of closing prices) / Standard deviation 20 days
Let’s look again at Apple graph over last few months!
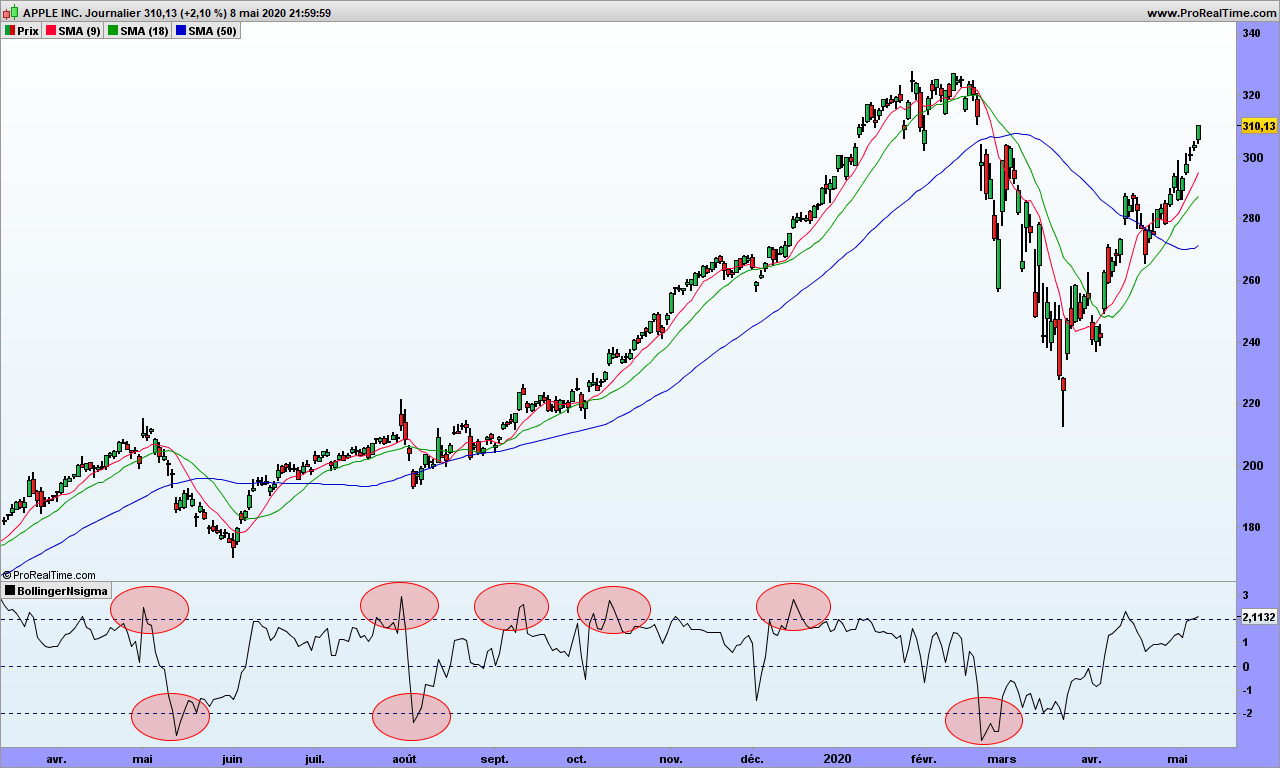
We have gone beyond the 2 standard deviation at least 8 times, sometimes for a few days. It is not looking good! If you are looking at S&P500, it reaches -3 sigmas once a year at least, when it should be the case more or less once every 8 years. Of course, it is probabilities, and this can happen more often. Correct, but there should be also long years without this far reaching. Which is not the case!
Now that you have spotted this interesting paradox, you have a new edge for trading! The best to trade Bollinger bands is just to NOT draw them. Remember that bubbles and parallels pointed by by Bollinger specialists are mere illusions!
Instead use our small indicator!
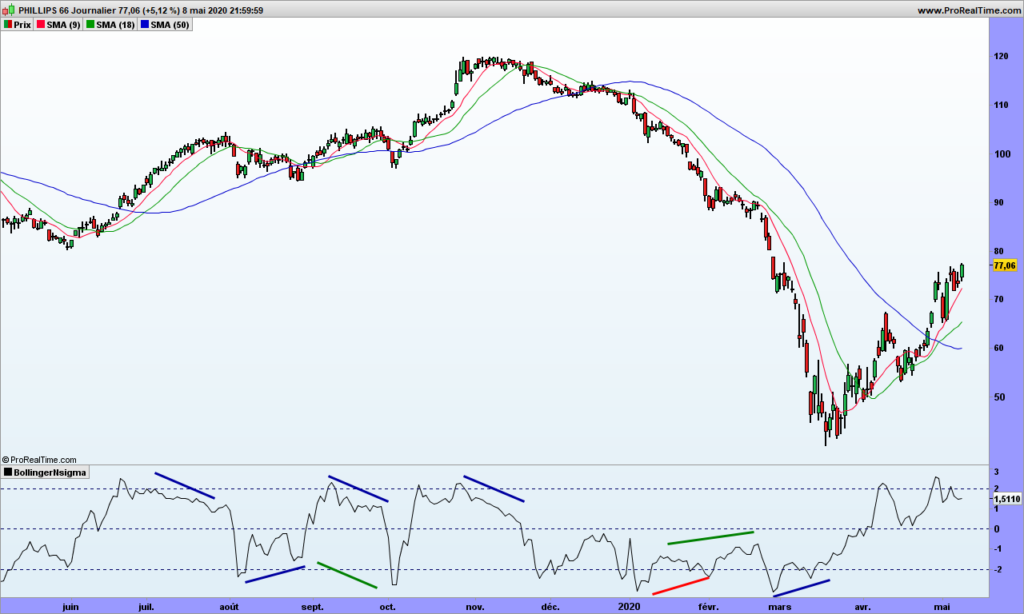
The indicator displays many divergences:
- Blue ones are standard divergences with the price to spot reversal
- Green ones show hidden divergences in the direction of the trend
I have highlighted a red one to show one that did not work. Be careful, if the trend is strong, wait for a signal to profit by the divergence, at least let the price go over the short moving average.
See, it is easy! For standard divergences, make sure first point is in oversold or overbought area, as indicated by the 2 sigmas lines.
One you are in, don’t get out of your trade at the 20-days moving average (strategy called ‘return to mean’), use a trailing stop, the green average for instance.
That’s it. Some people would charge you 5000$ per year to then send you the signals by email. If you do sell this service, please remember my commission!