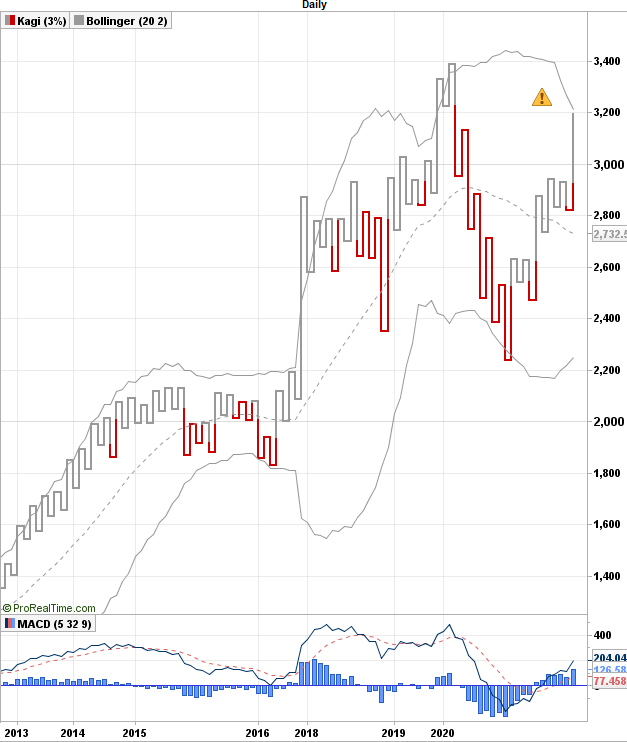
Warning signals conjunction are always important to watch!
The kagi line is closing to Bollinger upper band. From there, it can go through or reverse. In any case, it is worth securing partial profits or revise stops upwards.
On candlestick chart, price is also closing to reaction line shown last week. If it goes through, there is virtually no resistance until next one. Pretty much like a plane taking off, speed is important for air support under the wings. The opposite scenario is a sliding down the reaction line but we have yet to get a confirmation before looking deeper this assumption.
Two synchronous warnings should wake up your skeptical bull mindset!
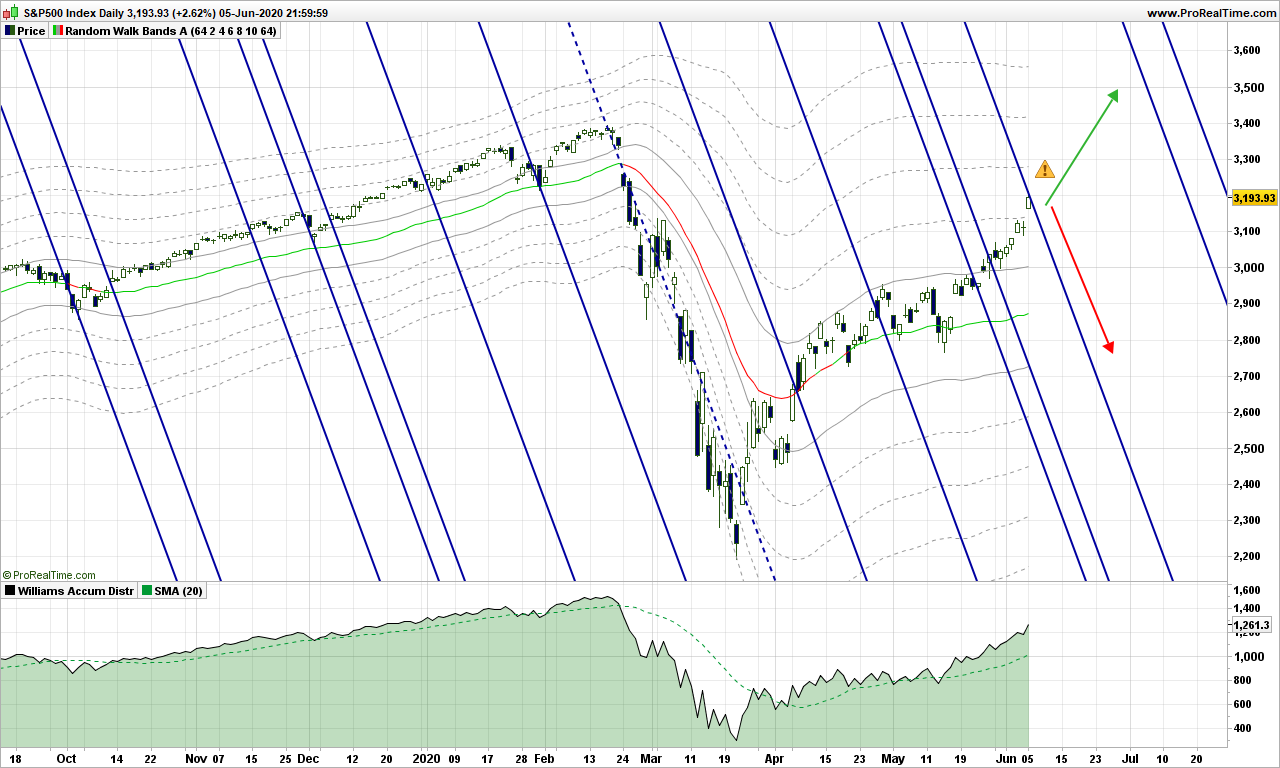
Hello! Mister Market is very optimistic, has gone through the last 2 reactions lines and has stumbled also further from the random path.
This optimism is really puzzling if you are looking at the news on TV but remember that S&P500 is driven mainly by the GAFA’s and Internet sector is big winner of the pandemic. Home office has proved a success for many companies and is going to be a source for cost reduction in the months ahead. Crisis are always the time when creativity works best and remote office was a solution only waiting for the opportunity to prove itself useful in crisis and at any all time!
What do we need to do now? Of course, keep a close watch on index evolution as it scrolls through upcoming reaction lines. There are then many stocks that are still low without any reason other than cash has flown to immediate winners such as Amazon, …. The other sectors such as 5G will restart shortly, American Towers is already making new all time highs! Fasten you seat belts and enjoy the rides!
I am sure you have noticed by now that this blog is totally original and I will not cover the basic indicators, their usage, … There are millions of sites that copy/paste from each other and you won’t learn from them anything but the basics. It is always a good idea to come back to basics, but profitable trading is about having an edge, so none of basic indicators work for very long, when too many traders are using one, market becomes sort of immune to it!
With this blog, I aim to help you kick some ideas down the road and if you wish you can share on this blog. Maybe it does not work for you as expected, but it may inspire others. Just drop me an email (see pinned message) and I will publish your article!
Let me share a story. For very long years, I made a few trades per year and had absolutely no idea how to get in or to get out. so I did some buy and hold based on randomly selected analysis, watching the stocks loose as much as 50% then going back up… And one morning I had an idea: imagine a very tall tree and there is a big coconut hanging from the top branches and a monkey happens to walk by and being thirsty. The easiest part of course is climbing, reaching the top, secure yourself to branches with feet and one hand while extending the other hand to take the fruit. Then suddenly, one branches cracks. You are still hanging from one branch with one hand but you are still safe, sort of! But for how long? The second branch is bending now and you must make a decision: free fall to the ground (not a good idea) or jump down other branches. This is how I started designing my first trailing stop! See? Let me know how you come up with trading strategies, fun to share and comment!
I still have plenty of ideas to share. I will not share publicly the details of my very best strategy because I am using it, but there is no problem sharing older research material that you can choose to improve on your side and share with the club! Just to give you an idea, we will look at in future posts:
Markets can trend and this is due to their random nature. See here.
The randomness can be measured by volatility. The raw volatility (be it 1-day momentum, True Range, …) is the one to be analyzed and understood
You should not try to confirm stubbornly a strategy because cases where your strategy does not work surely exist and might even be the most profitable cases! Market’s got some sense of humor :-))
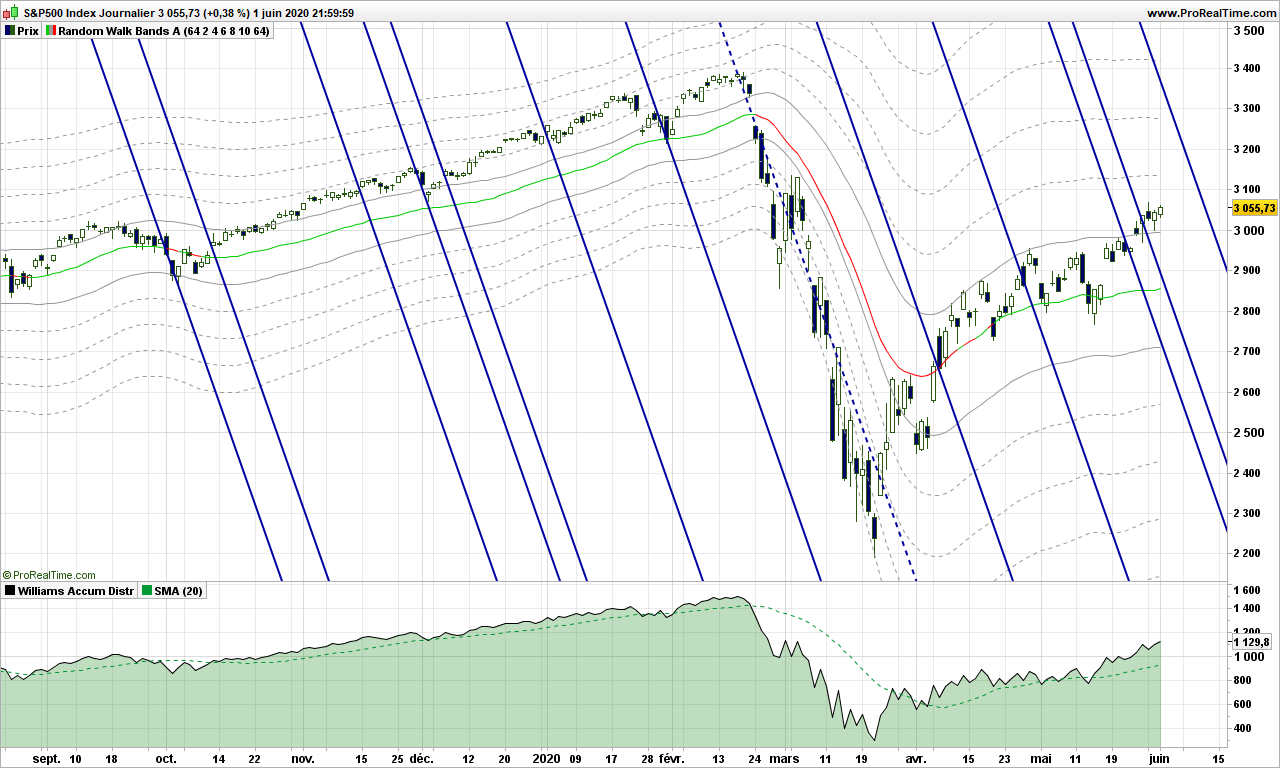
Now, as title implies, let’s look at S&P500 and where it is going!
As a continuation from previous post, I have left the random walk path and you can see that our drunken man does not seem capable to go more that 2 steps away from the main path.
If you have read my initial posts, you know I like a lot Action/Reaction lines because tops and bottoms are often building on those. Here we are precisely with 2 solid blue lines across the path. Unless S&500 goes through forcefully, we are in for a reversal. I have included Accumulation / Distribution at the bottom, which is a good indicator when you have nothing better, just add a 20-days simple moving average. There is not much energy: look at the slope of price versus indicator! We need some very good news to move up now! So yes, I would wait a few more days to see where we are going and go short if confirmed for an objective at 2400. This is absolutely no advice!!!