
I hope you had some thoughts about the market structures, how they are built and you understand why there is no need to have more figures. Each structure requires the use of specific pitchfork for an efficient trading. But first solution to the proposed exercice. I hope you had fun and did some drawing on a table, result should look like that:
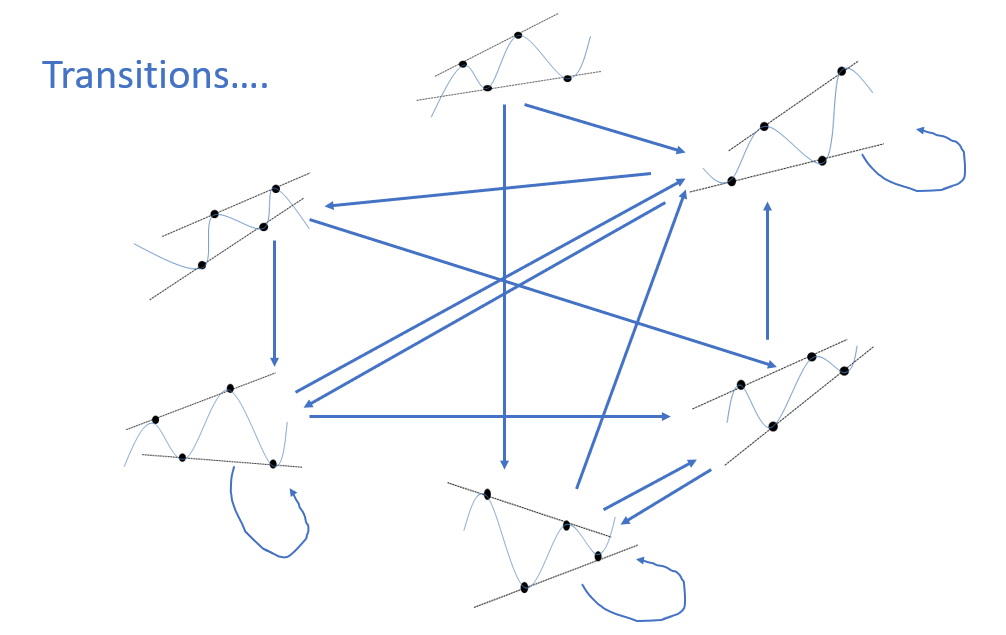
On second thought, there may some transitions missing here. I will let you find out…
There are a few points to remember from this study:
- When market is is consolidation mode, it can consolidate even more (the circling back for bottom figure)
- A trending market can move into consolidation without notice
- Reversal structures don’t end up in flat market
Let’s move now to mini pitchfork subject. On the following gold chart, I selected 4 swing points that describe an unstable market. If you refer to previous post, I can use a mini-pitchfork to get a buy signal.
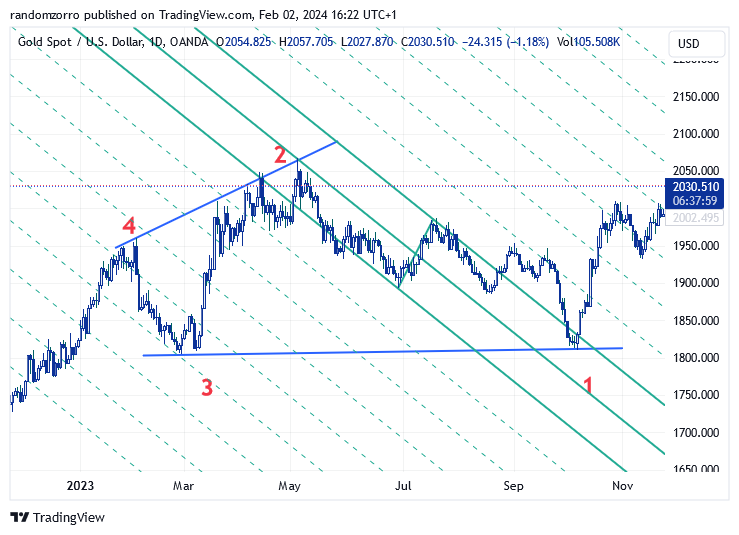
As you can see, I have selected minor peaks and troughs on the path from SP2 to SP1. I can’t say it is the most relevant choice but if you look at warning lines, prices are indeed stopped or pause before continuing their path.
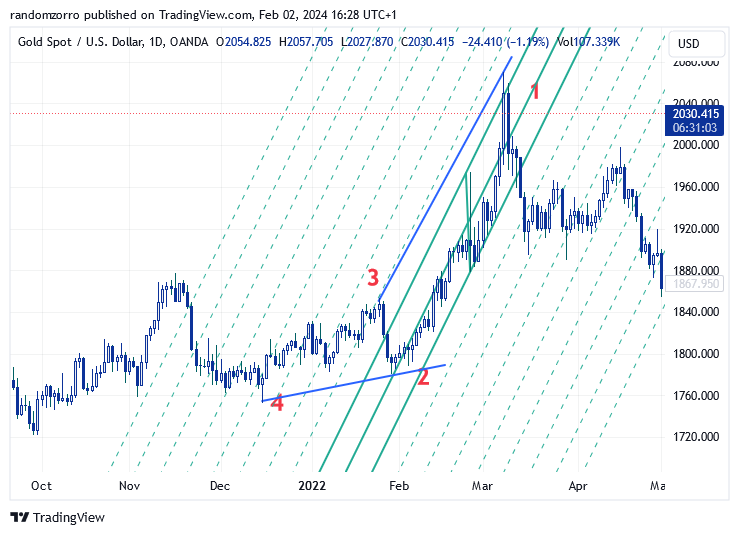
On the following example, it is not so obvious, but I used the extreme price at the end of wicks to create my pitchfork. An other way to trace it is going down to lower time frame so you get bigger waves….
Sometimes it is not possible to identify minor peaks or troughs, so we work it out manually. You may draw warning or you can attemps using the pitchfork tool to overlay your DIY pitchfork: select first SP on the HL line, take SP2 on upper line, and SP3 on lower line and it should do the trick
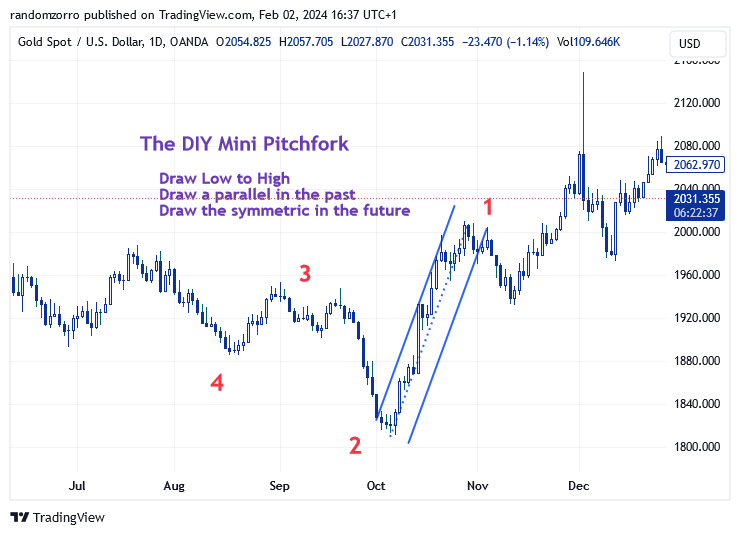
The way to use mini pitchfork is similar to other pitchfork. We will see many examples in future posts.
Until then, trade safely.