
After discussing raw volatility, standard deviations, no way we don’t have a discussion about ATR aka the Average True Range. This post will definitely blow you mind, I am going to demonstrate that markets are REALLY following a random walk path, pushing from one side to the other in a precise manner.
For introduction, please read again my previous post about drunkard’s walk.
Let’s consider an observation period of n days. The Highest High (HH) and Lowest Low (LL) may be considered as lamp post from which our drunken guy is walking. We know that on average we should be able to find him at a location situated at square root of n multiplied by average stride length or the Average True Range over n days to use financial wording.
Here is how it looks:
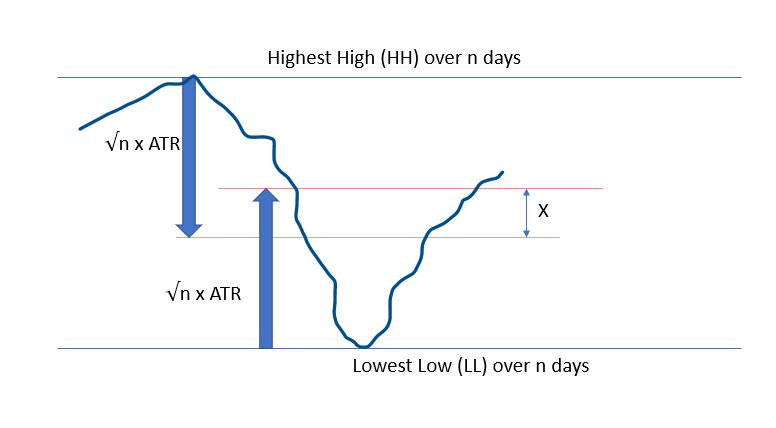
The red line is where Bulls expect price to be, whereas the Bears are waiting for the prices to reach the green lines. These are all average expectations of course, and these objective can be reached any time during the observation period. Please remember that down markets are usually twice faster that up markets.
What if we consider the middle price between these 2 expectations??
Let’s do a bit of maths:
- Today’s high (H) is expected at LL + 2 * √n * ATR(n)
- Today’s low (L) is expected at HH – + 2 * √n * ATR(n)
So the middle point can be defined as:
MP = .5 * ((H+L)/2 +(HH + LL)/2)
Of course price will not be there, X does NOT mark the spot, but it is a fair expectation about where prices should be, if there were no other information.
Let’s display it on a real chart!
We are going to use n = 36 in this post, you can use anything between 4 and 100, but make sure the square root is an integer for what will be following.
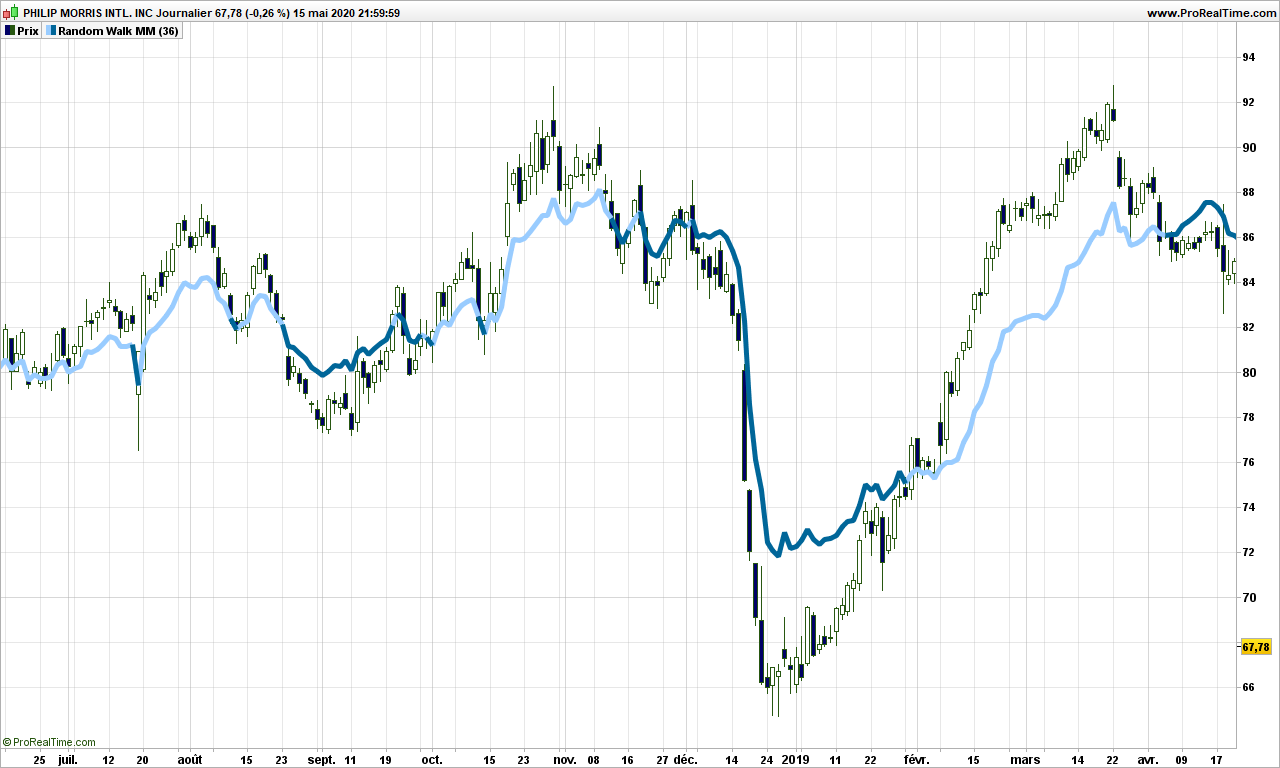
Ouch! It hurts the eyes. But you need to think of it differently. It is not a simple moving average, it is always using the most significant average of the day, between 1 and 36. Anyway you can already see that, when prices are above the path (light blue color),then trend is up. The path leaves a chance to prices to retrace and tends to be closer to them before a reversal.
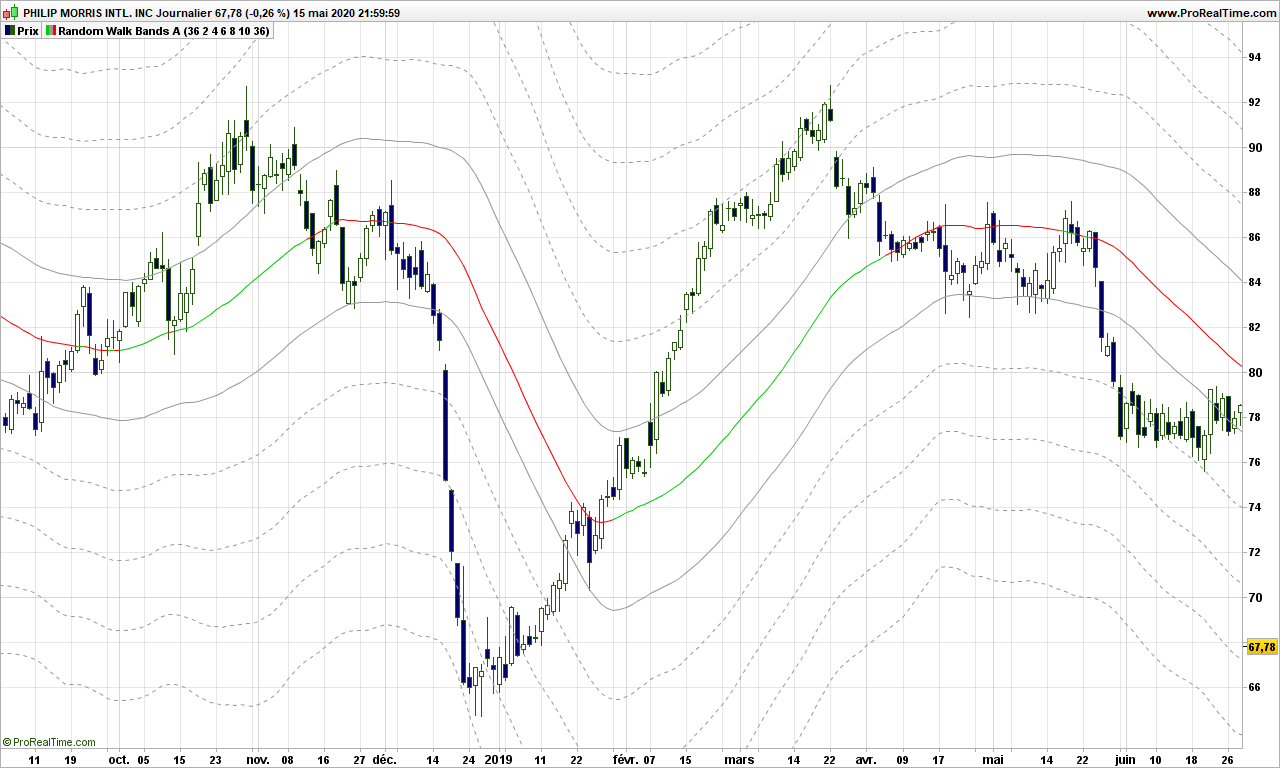
Let’s not stop there and use a standard average of this path to smooth things out. Now follow my reasoning!
If the random walk theory holds, then the path we have spotted may very well be a lamp post so the actual prices should hover at exactly a number of strides from the lamp post, not 3.7 strides, 4 really! Let’s do it and display some lines at exactly every 2 steps (2 ATR’s) from the middle path.
Whaouh!!!!!!!!
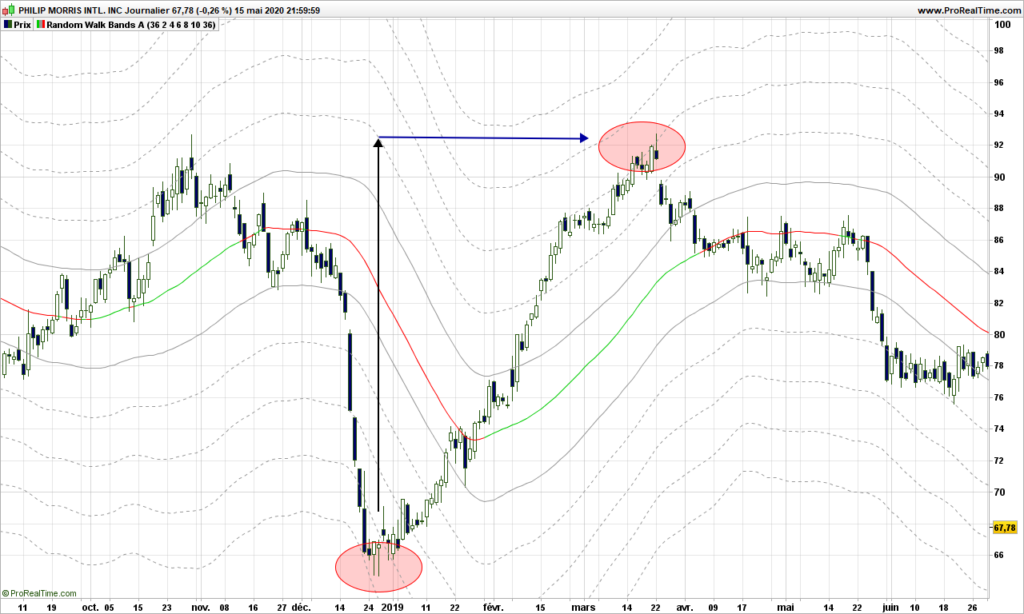
The red/green line is the smoothed out path. Prices are pushing along the lines, see only a few examples highlighted in red circles here:
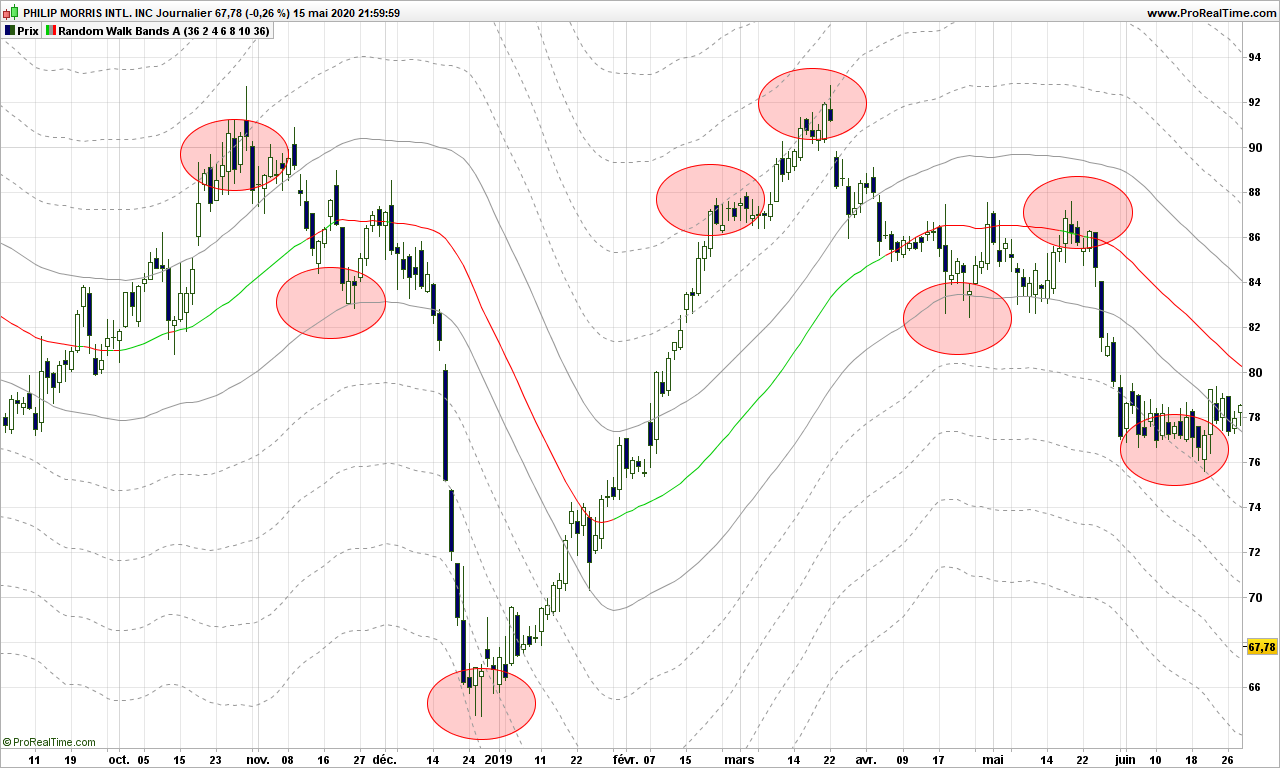
Just amazing.
One way to see it is to consider the middle path as the median line if you were using an Andrew pitchfork, first lines above and below are the MLH (median line high) and the other lines are warning lines!
Even better, if you are looking for warning lines above a major bottom, each represent a price objective. In the case below, the price identified on first warning line is reached a the top second red circle within .30$! (97.70 vs 97.42!)
Trading strategies are quite straightforward from then on:
- From a warning line far below median path, play return to the path
- From middle path that is going, play the trend and put a stop on a visible line below the price
- If price is ‘in the central pitchfork’, most likely there is no trend!
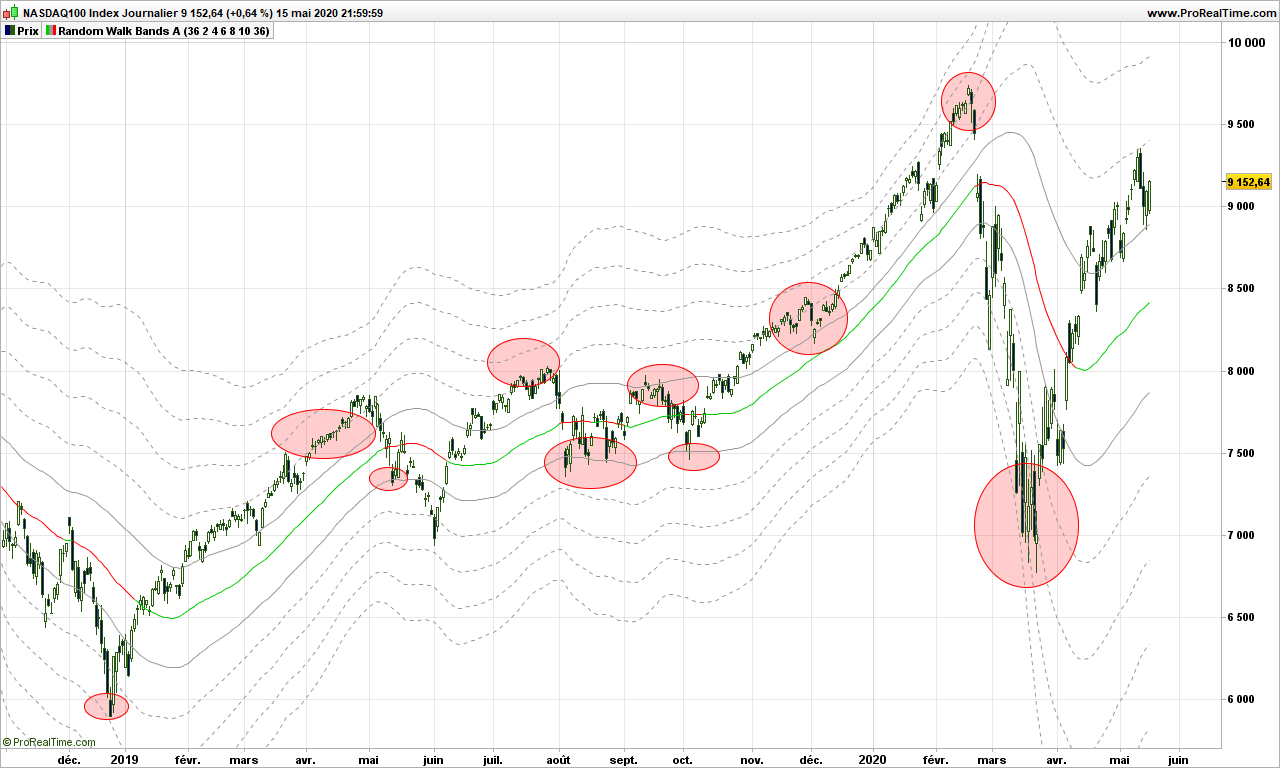
Now, you will tell, this is an example, sure it does not work with last market conditions? Yes it does!
Here is Nasdaq recent price action, stopped on a warning line!
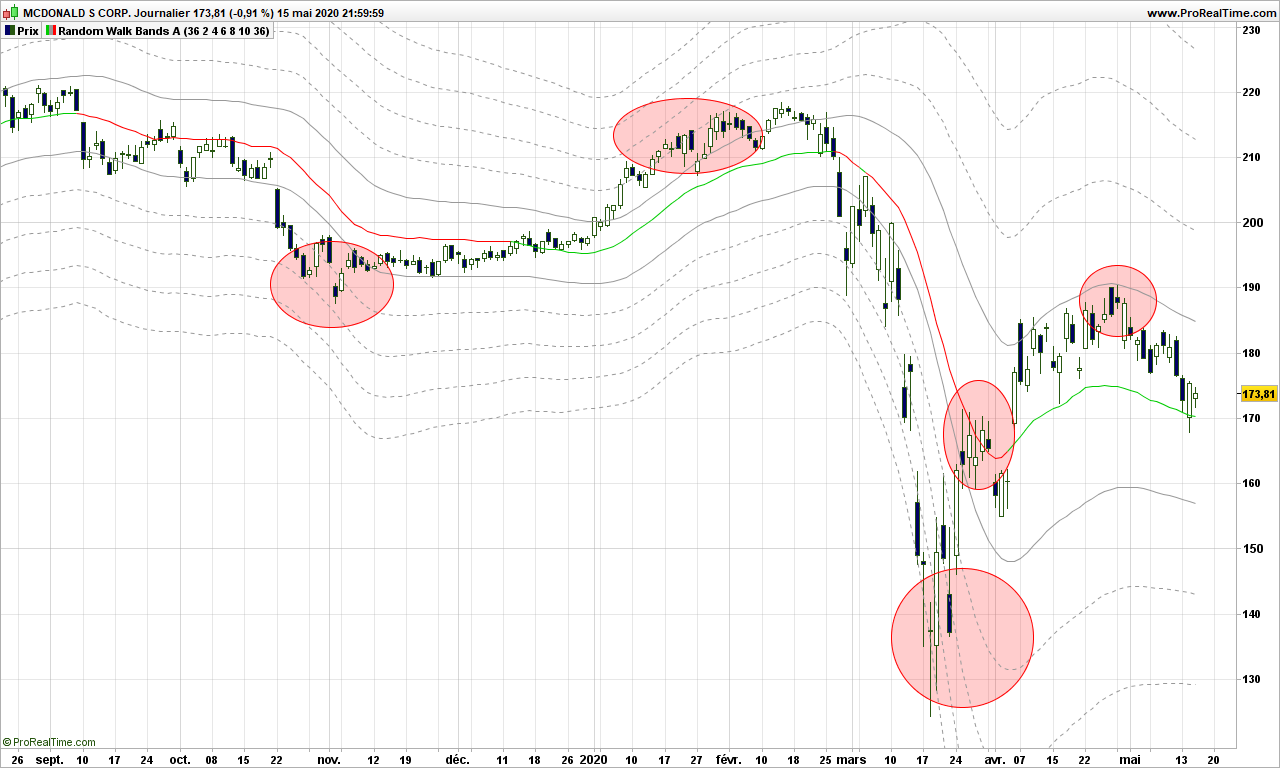
Or McDonald. Doing quite well!
Final thoughts: Market is moved by demand and offer. Behind these are drivers are humans or robots programmed by humans who can change their mind any time, giving the market a random outlook. This post would be worth many more investigations. Dr Andrew and his pitchfork really had a hint, but without computer, it was definitely more difficult for him. This is maybe the first explanation why Andrew Pitchfork are working and why it is so difficult to identify the right pivots to draw the pitchforks! Anyway, the random walk proves to a very good model, again because we are not trying to fit the data into a specific model or data distribution!
Feel free to comment or send email.
Until next time, trade safely!
These are actually great ideas in concerning blogging.
Good one! Interesting article over here. It’s pretty worth enough for me.
I really like and appreciate your blog post.
Like!! Great article post.Really thank you! Really Cool.
Looks like you have read all my blog, still a new and short one! Thank you very much for your kind feedback and support. Still have plenty of ideas to share, will also post some market commentaries!