[Beginner series] Trading with a pitchfork – Part 2

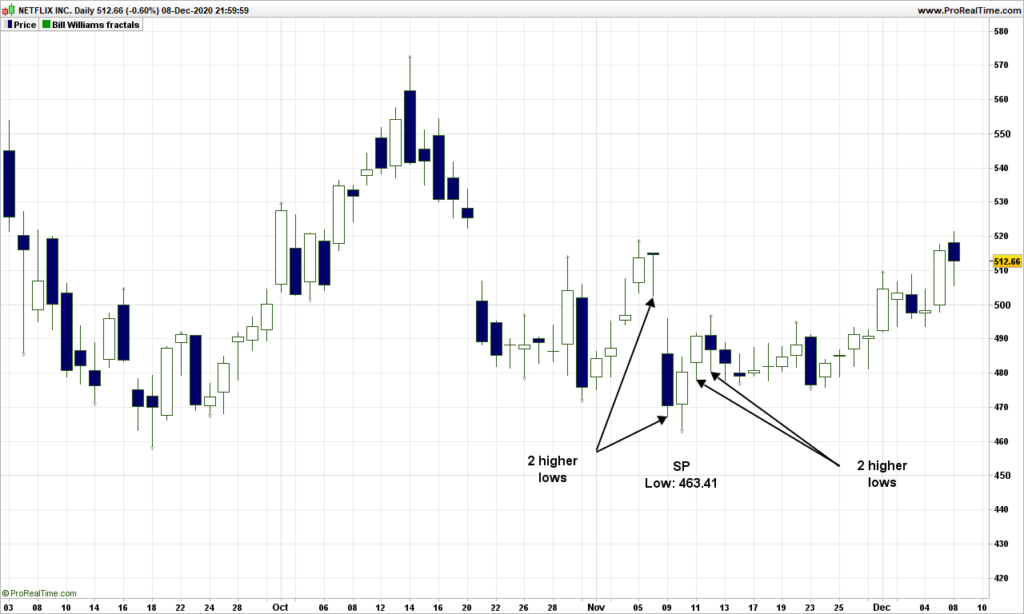
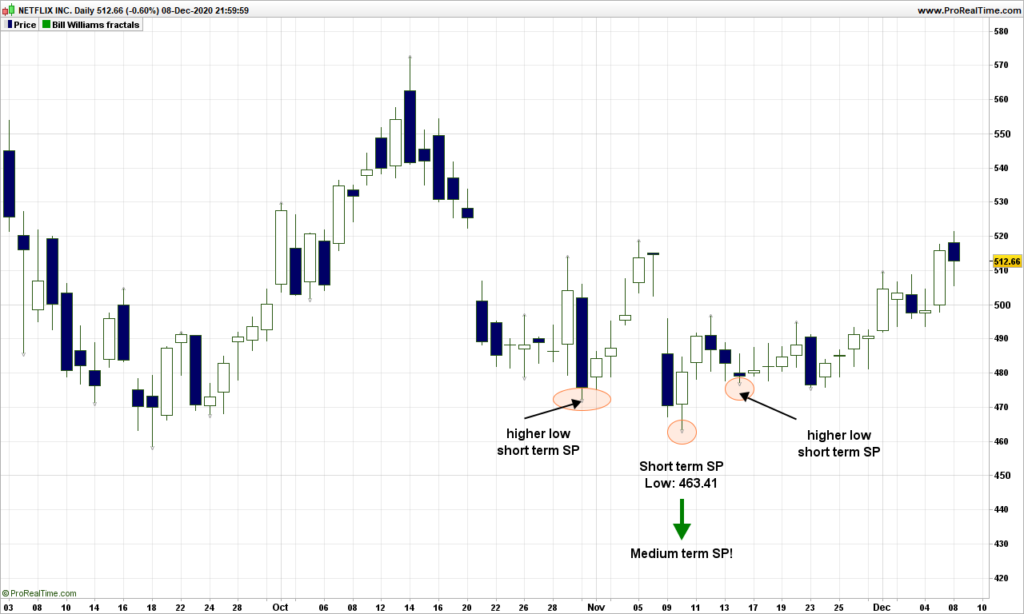
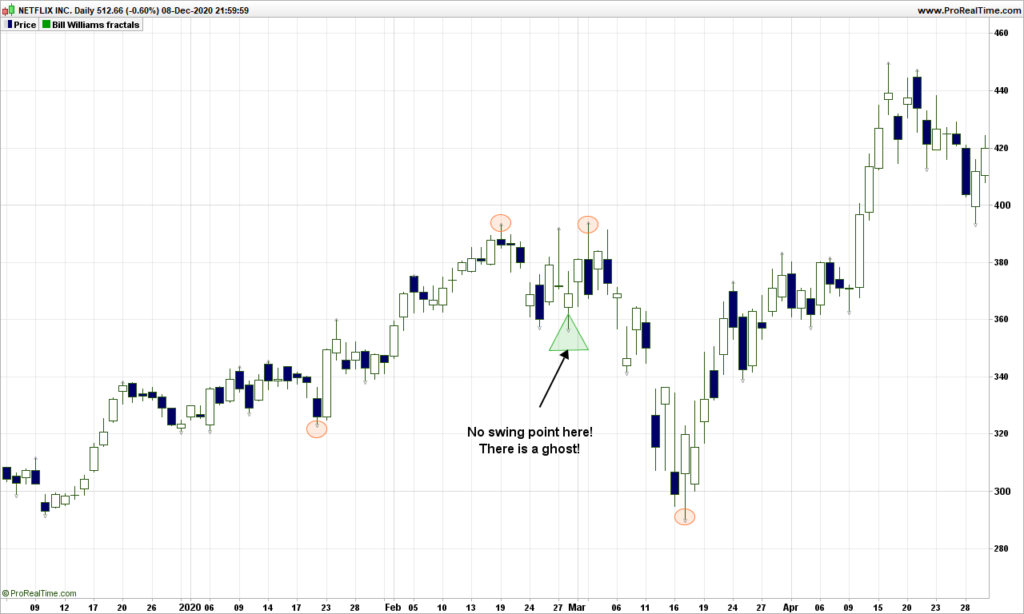
In part 1, you have learned how to identify key market turning points, which we have called Swing Point, shortened to SP. Swing points follow peaks and troughs in alternative way. Then we looked at short term and medium term SP’s. The last one are the ones we are interested in for drawing pitchforks.

Of course, the first question is why drawing pitchforks? Pitchfork is an interesting tool in the sense that is allows to identify trend in easy and blunt manner, no discussion is needed; then it gives buy and sell signal; it also measures the volatility! In short a dream tool, this is my Christmas gift to readers, but mastering will require some practice!

We are going to play with Exxon Mobil today. On the following graph, I have indicated the medium term swing points. Again take time to practice a bit here, because then it becomes (relatively) more difficult.

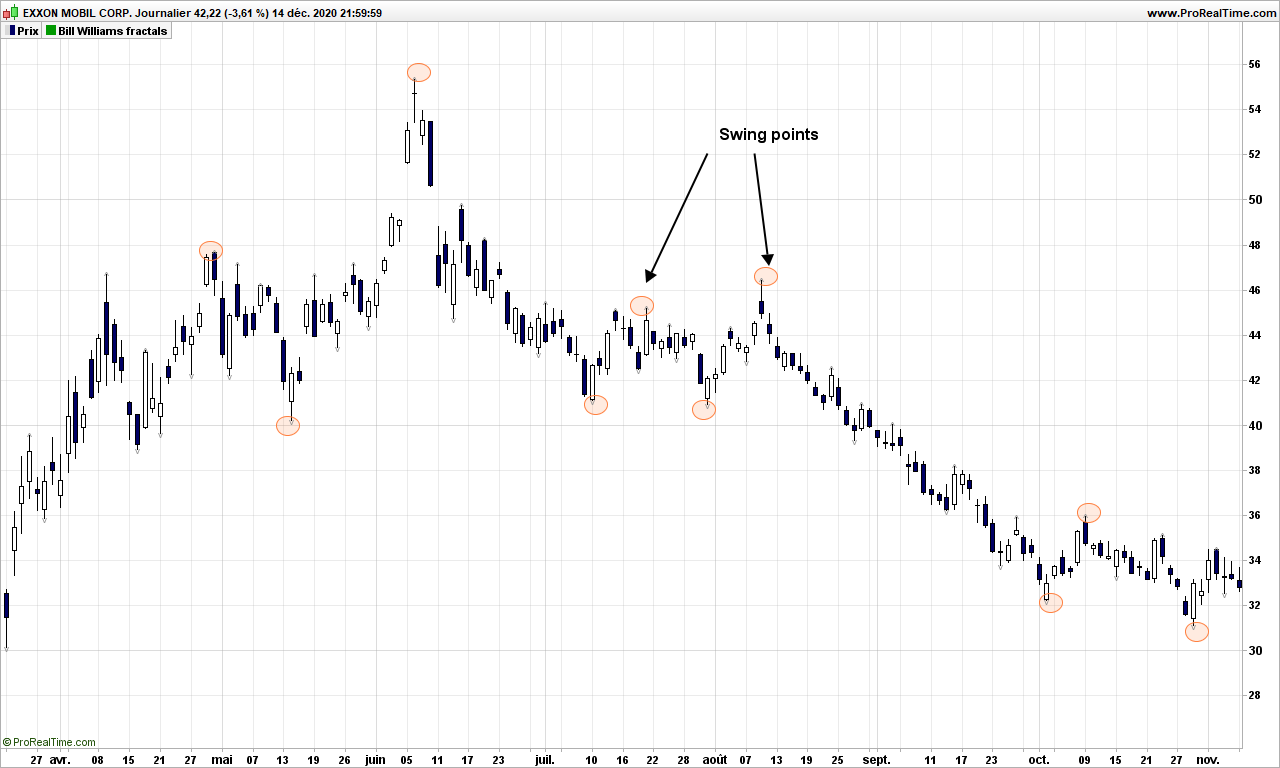
We are going now to number the SP’s, starting from the right of the graph, and in backward direction from 4:

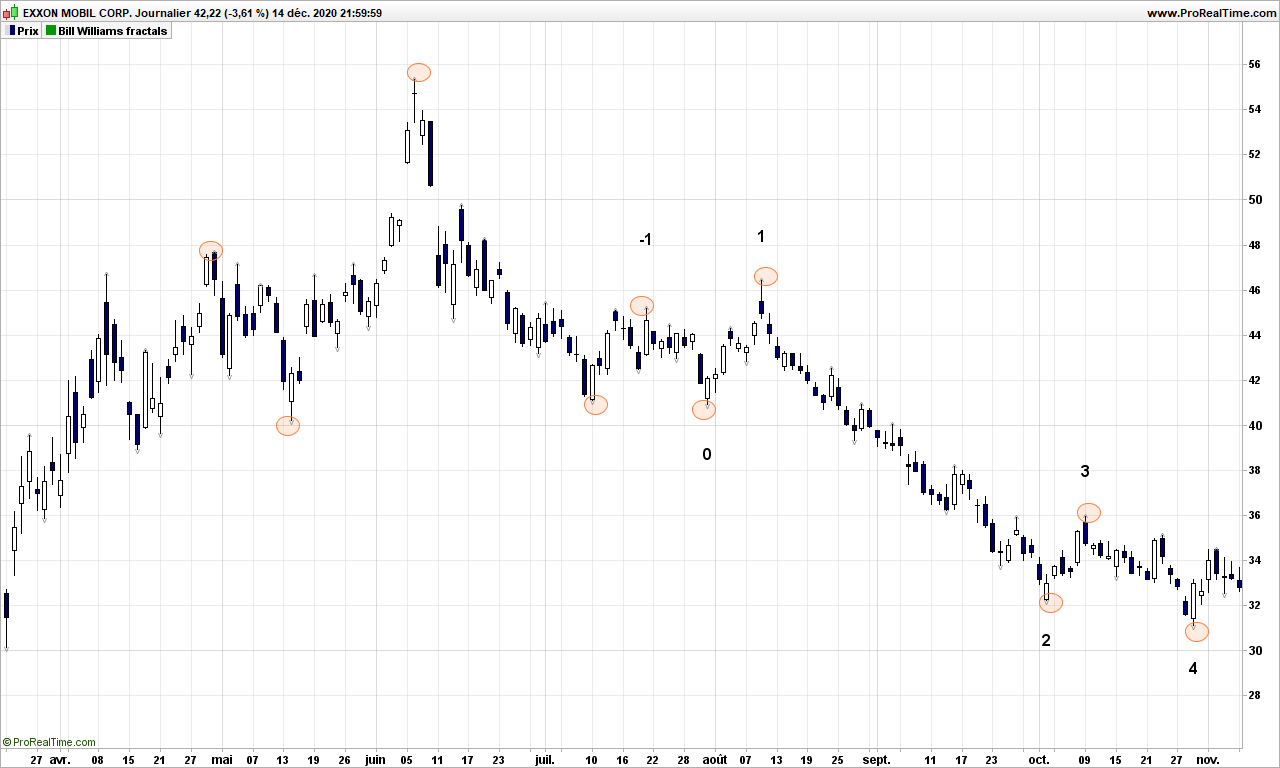
Tough, isn’t it? Then your charting software should have a pitchfork tool. Select it and select the swing pints 1, 2 and 3. You should get something like that:

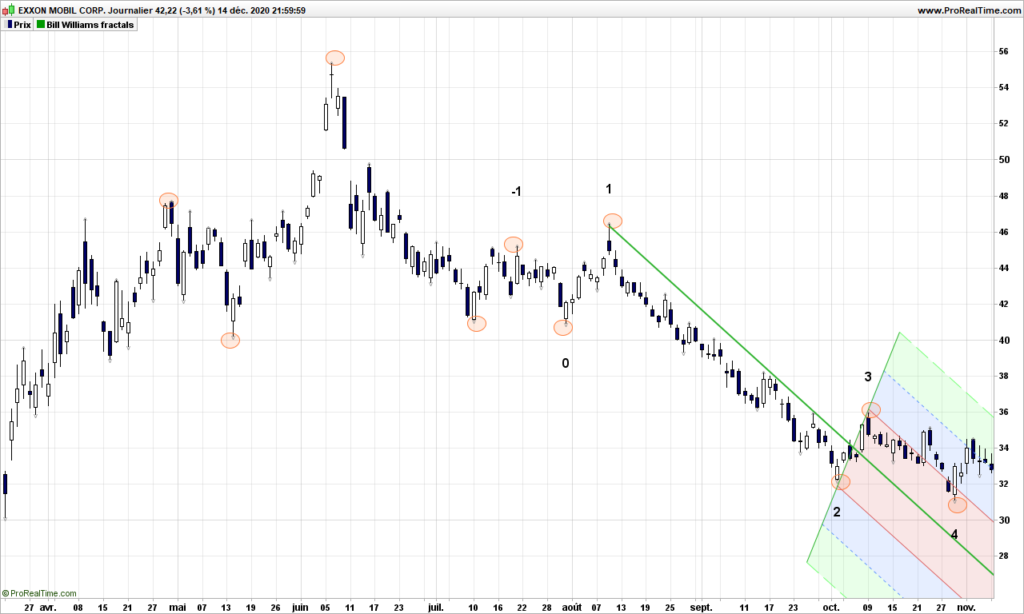
I am not going to explain the geometry used to draw the pitchfork, there are plenty of sites that do this. Let’s zoom instead on price action:

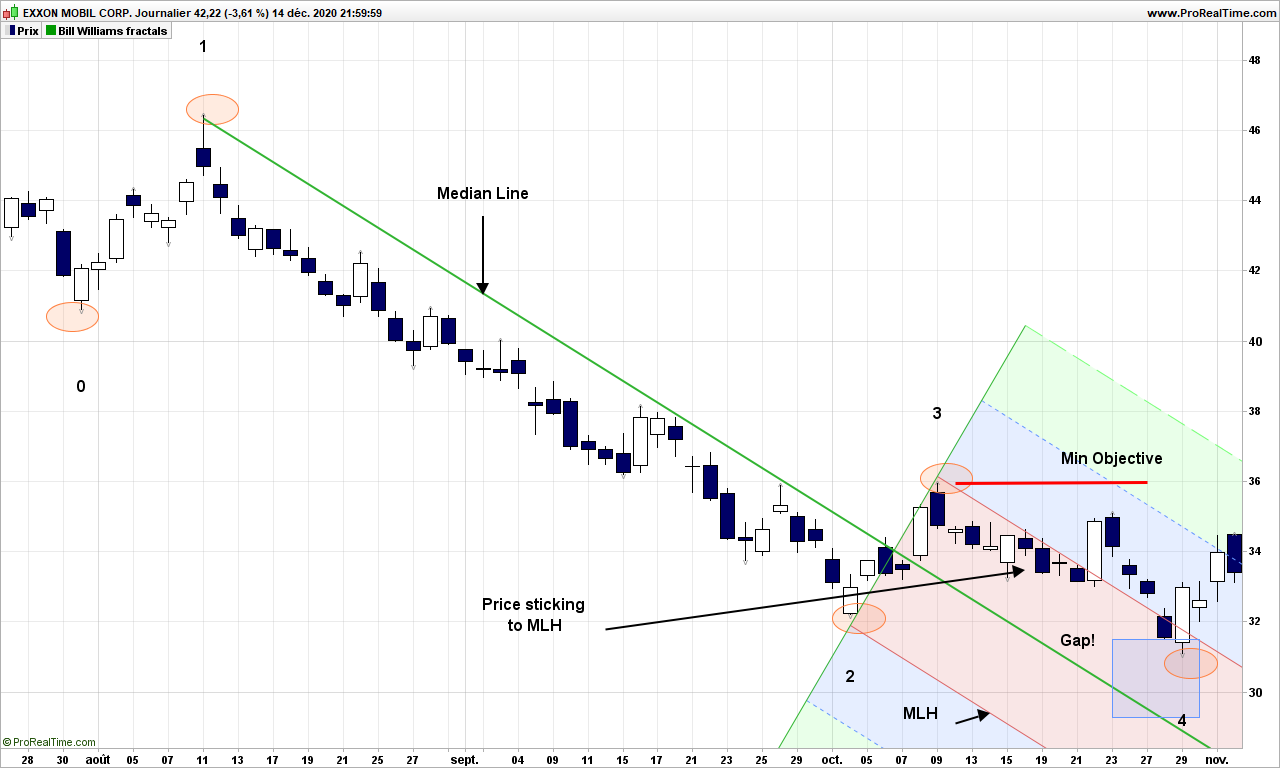
The green light is the median line, the red ones are the MLH (acronyms defined by doctor Andrew), are parallel to median line. After SP3, you notice that prices seem to adhere to the upper MLH, that is a sign of strength! At point 4, you can easily observe that price have not touched the median line, there is a gap between SP4 and median line, this is an other sign of strength and, according to A. Andrew, the minimum price objective for this situation is the price at SP3! The pitchfork is down trending and price have already exited the pitchfork even before SP4: this is the buy signal! We are all set up. We need to verify one last thing, the pitchfork made on SP’s 2, 3 and 4 should be trending up! Let’s draw:

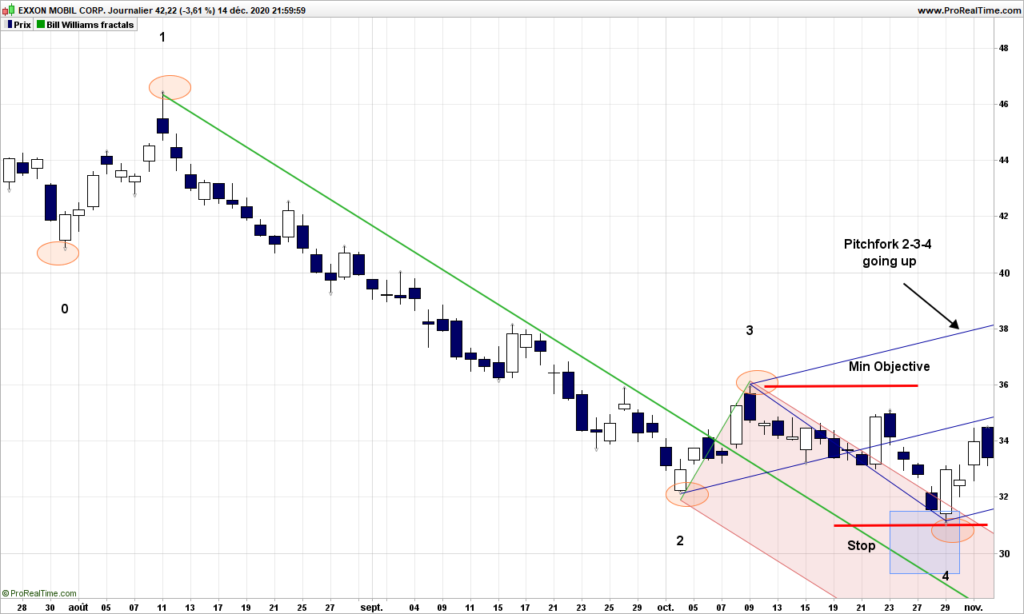
Everything is perfect. We will look in future post the rules and how to find out where prices might be going, but let’s use for now the minimum price objective, so you need to place an order with stop at SP4 and objective at SP3, meeting your gain / risk sensitivity.

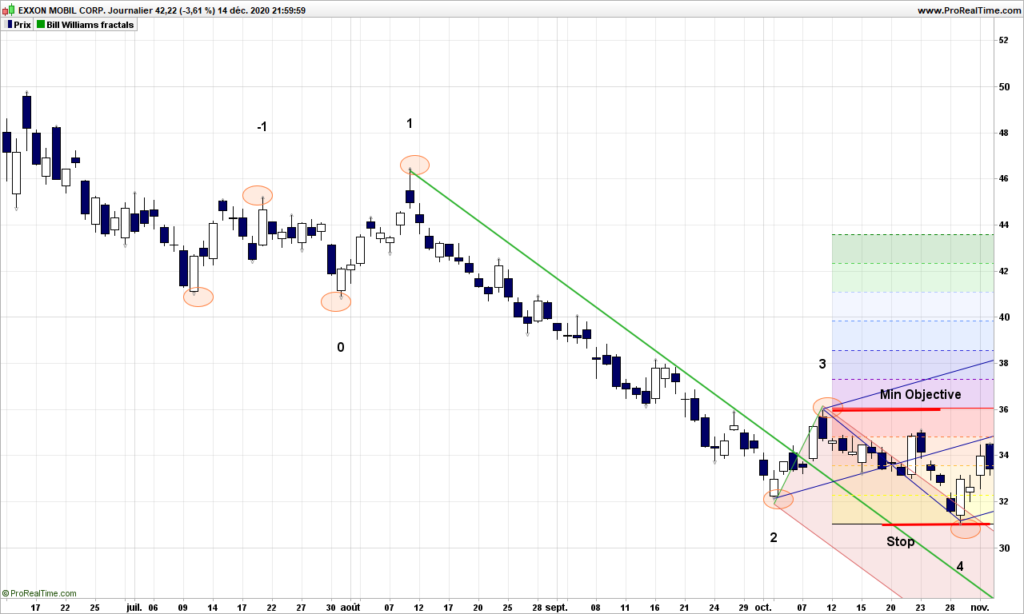
How did the trade go?

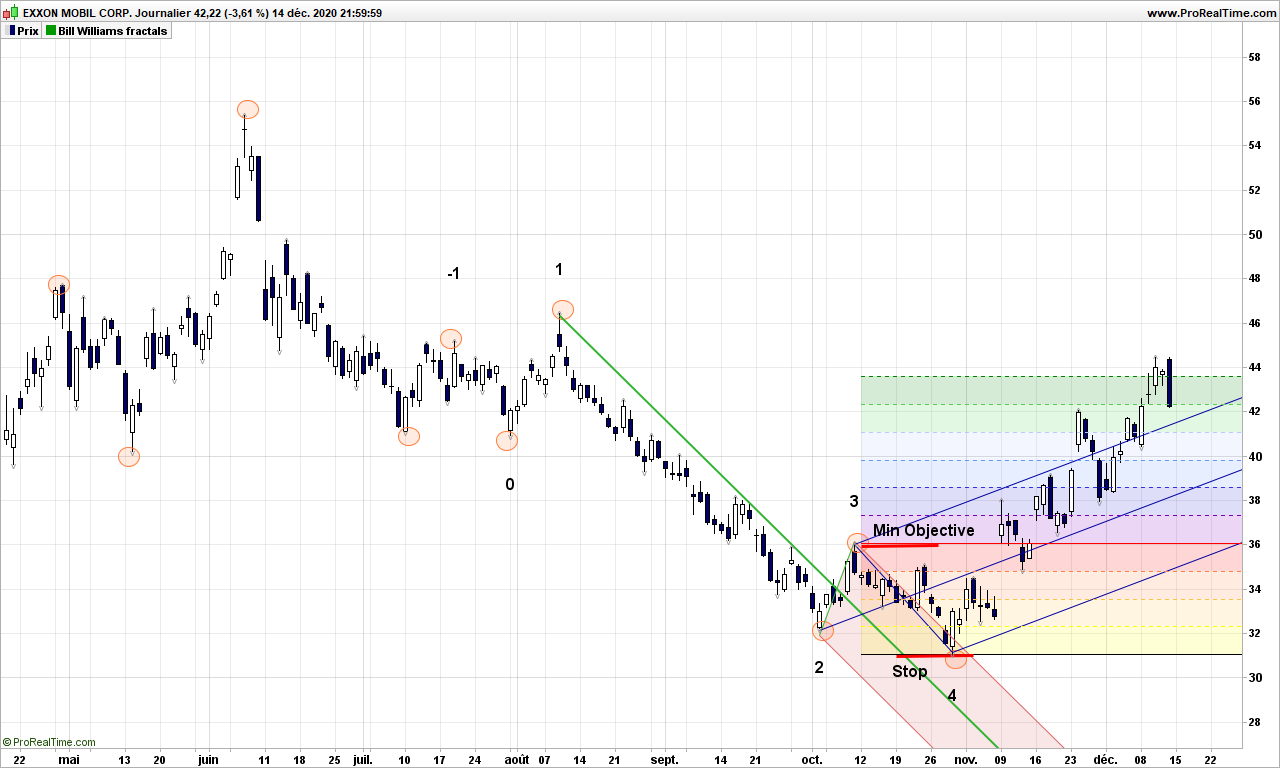
The min objective was reached only a few days later, then price has gone up since, landing currently a cool 33% at the time of writing!

This was your first pitchfork trade. Next time, we will look at the major rules to use pitchforks in safe and efficient manner.

Until next time, trade safely!

[Beginner series] Trading with a pitchfork – Part 1

We begin a series of posts dedicated to newbies in trading. I wrote a few times, there would be no such posts, but of course I will take radically different approaches from other web sites. Again, I only target methods of trading that makes sense for those with small portfolio, so there is no need to spend too much time on candlestick theory other than a few key information.

Trading with a pitchfork sounds weird, but it is one of easiest and most reliable and profitable method… providing you know what you are doing. The second part of the sentence is exactly what is missed on some popular sites! Pitchfork trading is usually compared to channel trading, which it can be, but that is very poor usage of this wonderful tool!

Before we introduce the tool, you need to first major in peak and troughs analysis. Don’t go away just yet, it is pretty straightforward with a little practice. Peaks are … peaks and troughs are … just troughs! The major ones are usually easy to identify!

Let’s start immediately with an exercise. Can you point peaks and troughs on this Netflix chart?

Maybe you ended up with this, peaks with green ‘P’s and troughs with yellow ‘T’s

If you did not end up with same collection of peaks and troughs, that is fine. We are working with random system, you are allowed some deviations!

There is one important rule is that peaks and troughs must alternate: P – T – P – T – ….

Is there any way to automate the discovery of peaks and troughs? Answer is yes, and there exists more than one. But in order to respect previous rule, you will sooner or later meet some ghosts!

One way to to identify a trough (same for peak) is by using a two steps approach, first one can be automated easily, second one is more complex!

First step is to identify short term ‘swing’ points (SP), generic term for peak or trough. A swing point for a trough is simply a day where the low of the day is surrounded by two higher lows on each side. Example:

A medium term trough swing point is surrounded by one higher low short term swing point on each side:

Easy, isn’t it?

The medium term swing points will be the first ones of interest when playing with pitchforks.

Before I let you think on your own, remember the rule above, swing points must alternate tops and bottoms. But sometime, you will be missing a medium term swing point with the proposed method, so you know there is a ghost swing point!

Next time, we will look at how to anchor pitchforks to swing points

That’s it for this post! Comments are welcome!