Risk / Reward Ratio: my relative take on it!

We have previously discussed the win/loss ratio and the impact on occurrences of winning and losing streaks. You may fix it somehow, especially if you are lucky, but if, like for normal humans, it is not always the case, then it is not enough to be profitable.

Imagine the following:

  • Winning percentage: 40% Loosing percentage: 60%
  • Average performance of winning trades: 20%
  • Average loss of losing trades: 15%

Then your gain expectation over 100 trade is .4*20-.6*15 = -1%

Your expectation is negative, you will not win over the long term! Remember it is an average expectation, the actual can be far lower.

Whatever your win/loss ratio, the risk/reward ratio is here to help counterbalance the effect of luck. Say you bet 1€, you may lose it or gain it back. Is it worth playing it?   NO! You are better off keeping your 1€ in your pocket.

It is the same for trading. If you bet 100€, you wish to get at least 150€ or much more. This is sometimes called asymmetric position. The risk/reward is calculated opposite:

%RR = (potential reward) / (risk taken)

In our case: %RR= 150/100 = 1.5

To be honest, I never take trade with %RR less than 2.

You will see in many books or websites that you should never risk more than 1% of your trading capital on a single trade. It tends to be confusing for many because this 1% tends to become bigger as capital grows and since you still want to sleep at night, it is better think in a different manner.

The question to ask yourself is this: if you lose 100€, does it hurt? No? what about 200€? 300€? Oups it hurts too much! So be it, you are just above the pain threshold.

Take note of this value, this is the (absolute) risk, the divisor in the calculation above.

I have discussed previously how-to guesstimate a potential objective (with drunkard’s walk for instance).

So, we are ready to trade!

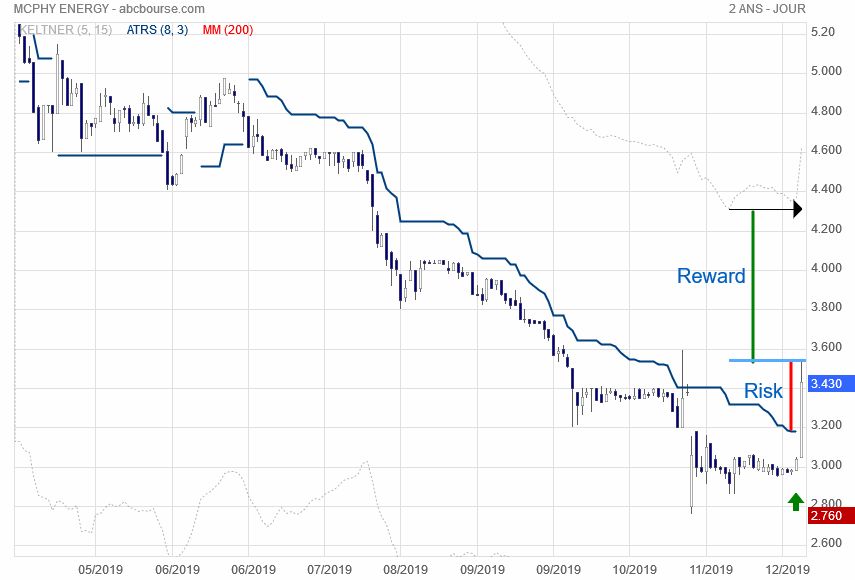
Let’s take an example. A signal (green arrow) indicates you have trading opportunity. We assume you will buy tomorrow just above today’s high at 3.56€. The stop is at 3.18€ and possible objective is 4.31€

%RR = (4.31 – 3.56) / (3.56 – 3.18) = 1.97

Not too bad, uh?

Now we need to ensure you are not crossing the pain threshold! Let’s assume for a moment that it is 100€. Small but why not.

Now you can size your position accordingly.

The risk for each stock you buy is 3.56 – 3.18 = 0.38€

Therefore, the number of stocks you can buy = 100€ / 0.38€ = 263 (rounded)

So you will invest: 263 * 3.56 = 936€.

Just be sure to sell if the stop is reach so that your pain does not exceed too much 100€.

Should the objective be reached, you will have gained: 263*(4.31 – 3.56) = 197€. In line with our win/loss ratio 🙂

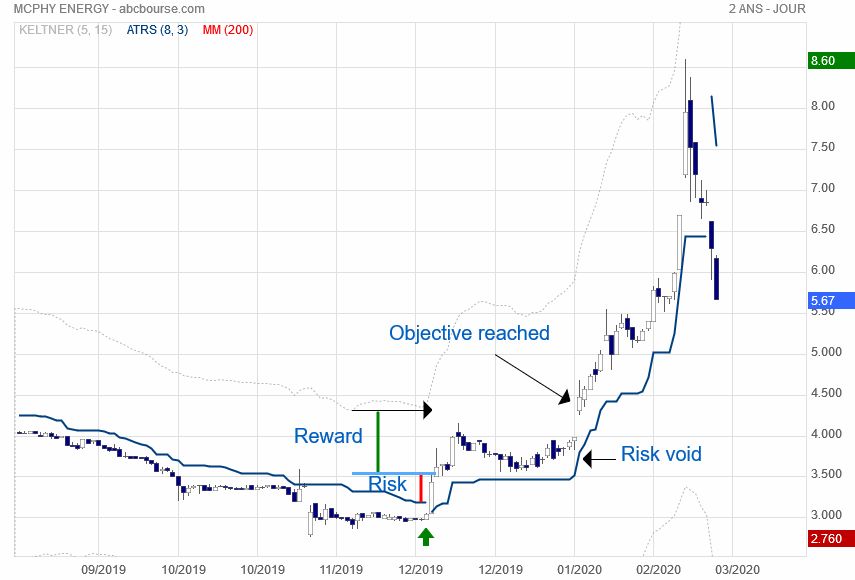
If all goes well, after a few days, the calculated stop will start hiking up, so your risk will be void.  After objective is reached, feel free to take back some profit and let your profits run.

How did it go for this trade? It went far beyond my expectations!

In summary, you may be a stoical kind and only look at the risk in percentage or relative view. For most of us, it makes more sense to look at the risk in absolute value and sleep well at night because we are not risking more than we can afford money-wise and psychology-wise.

How far will the market go?

When you want to know where price is going to go, there are many ways to guess. Among others:

1. Return to average. If price go too far away from average, then they are likely to go back to average

2. Fibonacci retracements and extensions

3. Check analysts price objective

The weakness is the same for all: when? in one swing or after many up and down swings?

With volatility trading, we can answer thoroughly two different ways

1. The drunkard’s walk

The concept  of ‘drunkard’s walk’ was introduced by  William Feller by the following math problem:
If a drunk guy leaves the lamp post he is leaning against, how far would he have gone, on average, after n steps?”

The answer is he would have gone the square root of n multiplied by the average length of his stride:

√n * Average length of stride

Here is how to translate for price objective setting: start from a major price bottom, the first objective that should be reached within n days is the average price change (or Average True Range)

Example: if we look at an ATR over 25 periods (days, weeks), the first objective that can be reached in 25 days is lowest low (the lamp position) plus 5 x ATR25.

Easy, right? If objectif is not reached, then just give up.

When we say first objective, it is because we are considering a random walk, but if a trend is given birth (or the street has a slope for our drunkard), then prices may go much further away and you need to re-estimate the new objectives with each swing low.

2. Action-reaction

The usual way to use action-reaction is enclose price action into channels, so as to get high probability entry points. Also the distance between lines gives the potential objectives in straight lines.

I am removing previous lines for clarity but I am now drawing an other set of lines. Distance between the lines also indicates potential

By having two sets of AR lines on the chart, crossing of lines indicate precisely where prices are going to go. There may be several possible objectives, but many can be discarded (too sloppy change required, or objective in the past)

See here yellow highlighted target reached almost on time (depending on accuracy of lines drawing)

That’s it! Because we are analyzing price and time together (aka volatility), we are reaching high quality trading

Volatility trading? Hmmm…

All the content on this website will be original. No lessons about Bollinger bands or how Average True Range is calculated.  This first post will reposition volatility trading with respect to other kinds of trading.

For this purpose, let’s travel east to reach China. They have theories like Yin and Yang but the one that interests us more here is the 5 elements theory. According to it, plants, humans, animals are all driven by a cycle including 5 elements: wood, fire, earth, metal and water. There are 2 cycles actually, one for creation and one for destruction. The market being driven by humans, and robots are programmed by humans so are no exceptions, this cycle to market themselves!

A stock has been issued by a company, this is the wood. Then wood generates fire, price is matter of hot arguments we need lots of computer to finalize. The way prices go and up and down each is volatility, it is earth, it is linked to muscles, so the market is shaping up. Then from the volatility appear trends, which is kind of illusion that prices are going in one direction. Once trend appear, volumes change; volumes are like water of the river, they make the market. When price goes up in a trend, then volumes go down as nobody wants to sell before the trend is over. Volumes in turn change the company; if lots of money flows in, then they have capability to invest and this in turn will change the price of the company. Cycle is over!

From a trading perspective, you can position yourself wherever you want:

  •  At stock level, traders carry out fundamental analysis. Their strategy is usually buy & hold and they want to catch dividends for the money you invest in. They don’t usually care too much about the actual price, saying it doesn’t matter. They come up with funny price  objectives by comparing with other companies in same sector and when the stock plummets, they say they keep it for long term!
  • At price level, traders are usually day traders, order book traders, robots… They draw lines which they call support or resistance. They of course totally disagree with one another, given they are not looking at the same chart with same time frame.
  • At volatility level, there is … almost nobody. Nobody is pure volatility trader. People hate volatility (subject of another future article). Bollinger himself agreed his bands are far from perfect. Keltner also paved some way. This area is still not much explored. The point is you need to ‘see’ things in all this random data that is the market. It gets lots of convoluted mathematics to play here. But the rewards are great
  • At trend trading level, one will meet sour guys. Why? Because they are blamed any time the market plummets, as they openly say they play both upside and downsides of the markets. They may have low success rate but when they win, they win big,  and so an overall positive expectancy
  • At volume level, traders have lots of money to manage. So they can call the company’s CEO and advise on the strategy or the volumes might just die, right?

That’s it. There are times when you need to trade price level (sideways markets), other times when trend is a better choice , or dividend playing at some other time. We need to get an edge to enter the market and to exit.

Until next time, trade safely from the right perspective.