
Random Walk Index is an indicator widely available on all chart platforms, but once you display it, you come up with the immediate conclusion about it uselessness.

Indicator is made of 2 lines, RWIH representing bulls in blue color, and RWIL representing bears in red colour.
There are many problems with the display:
- The calculation of red line is completely wrong if your refer to the formula and try the calculations in Excel for instance. Why can the same bug be seen on every single trading software????
- The ATR formula used by the software are NOT a simple moving average. They use RMA or others.
Have this interesting indicator powerful features been concealed? On intent? I will let you devise, this post will attempt to restore its original features, and provide enhancement to make it more readable and useful to lay traders
Same chart as above but with original formula
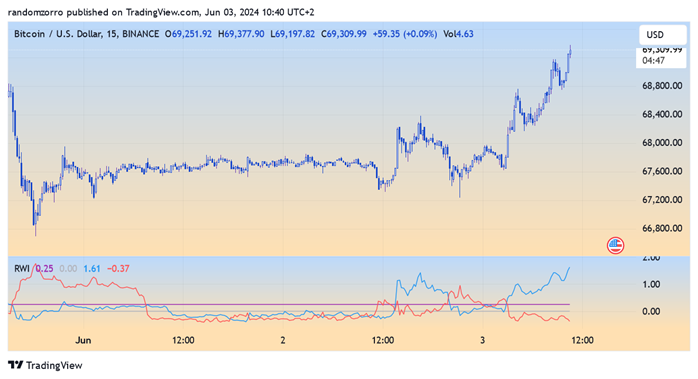
As you can see, it looks completely different.
The RWI has first recentered to zero and an horizontal line has been set at 0.25 level. When the blue line is above this level, it clearly indicates a bullish trend and the opposite for the red line.
When both lines are below 0.25, and even better below zero, it indicates a flat market. If only below 0.25, it indicates a local congestion zone. In any case, we can think of those as accumulation or distribution zones.
By construction, the RWI takes into account prices (calculated upon highs and lows) and a time window (the input parameter). Inside this window, movement is considered random and you can refer to drunkard walk theory in this post to know more.
This looks like much more a useful indicator, isn’t it?
Let’s not stop here and add an other line, similar to Directional Movement Index (and ADX, ..). It will be differnce between the 2 index lines, smoothed by a SMA.
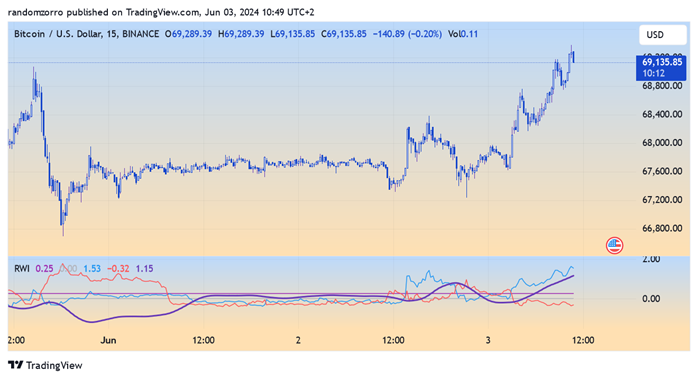
This RWADX line allows the anticipation of crossings and is another key. It can be of further fitted by a signal line to deliver buy and sell signals.
On top of trading rules already mentioned, we can add these ones to use the RWADX:
- When RWADX crosses it signal, it may indicate a buy or sell signal. One RWI must be above zero and go up, while the other one must go down and value below zero.
- When there is a divergence with prices, one must understand the cause as we are working with a time window. A previous peak may not be accounted for any more. The way to check that is looking at upper time frame.
- When the signal occurs in counter trader (buy signal below zero), one should drill down to lower time frame to run a with the trend trade.
Let’s look at two examples:
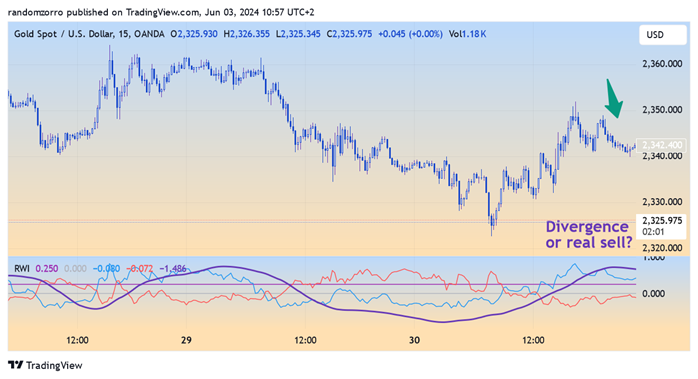
Moving up to 1h time frame, we see both RWI ines going below zero, indicating flat market.
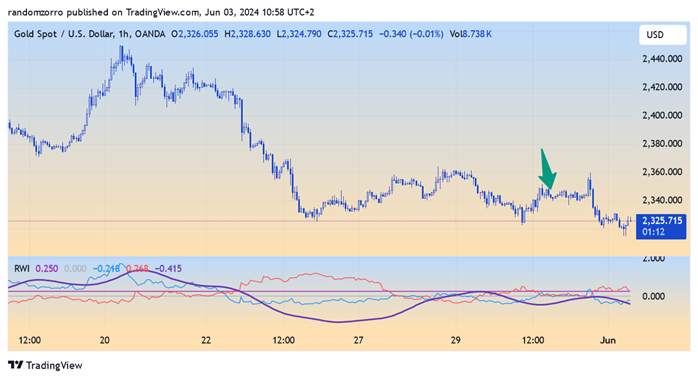
Now Let’s look at this short signal
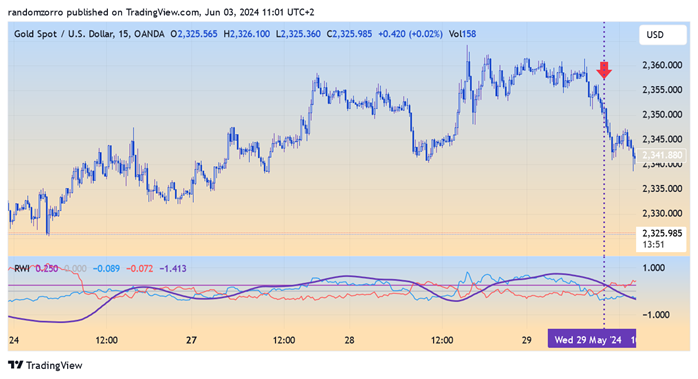
It is countertrend trade, so let’s drill down to 3 minutes chart:
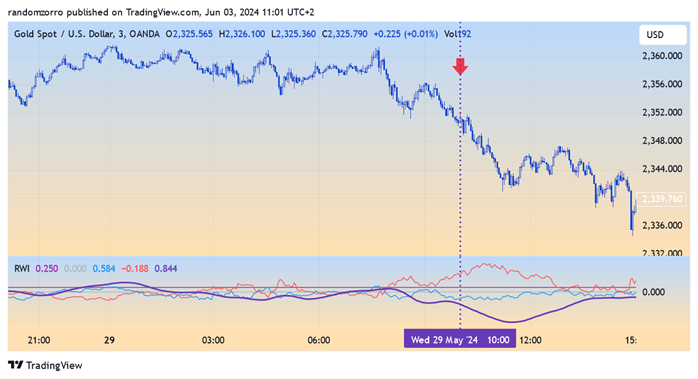
Great, here we have a stong trend, we could have anticipated the entry of course, but still a lot of profit to capture 😊
This is not complete trading system, we would need to have SL’s and TP’s. But even the crossings are extremely nice entry and exit signals.
Conclusion: the RWI has been around for a very long time, has surely been scraped intentionally to hide very powerful features. It goes even further, if you replace RSI by this revised RWI in other indicators such MCDX, you will get sharper and more accurate signals. You will overall a different understanding of the market, so it can also be used as a confirmation. Its capability to detect flat and congestion markets make it an invaluable tool in your trading strategy.