
I have been a fan of Three-Line-Break (TLB) trading for long time because it is a KISS (Keep it Simple Stupid) methodology and takes no time to make decisions, which is mandatory when you have an other full time job! As long as I did not have any backtesting tool and was working only small caps which are trending usually for longer period of time, then the feeling was there was a positive expectancy. However, from time to time, I experienced losses more than I liked, and felt like missing trend departures.
Once again I assume you are already knowledgeable about the basic topic. For more details on TLB, please refer to here
Backtesting becomes possible when you can actually display the TLB back on daily chart. On the following chart, you can see on the right the TLB chart, with red and green lines; these appear on the left candlestick chart as red and green boxes.
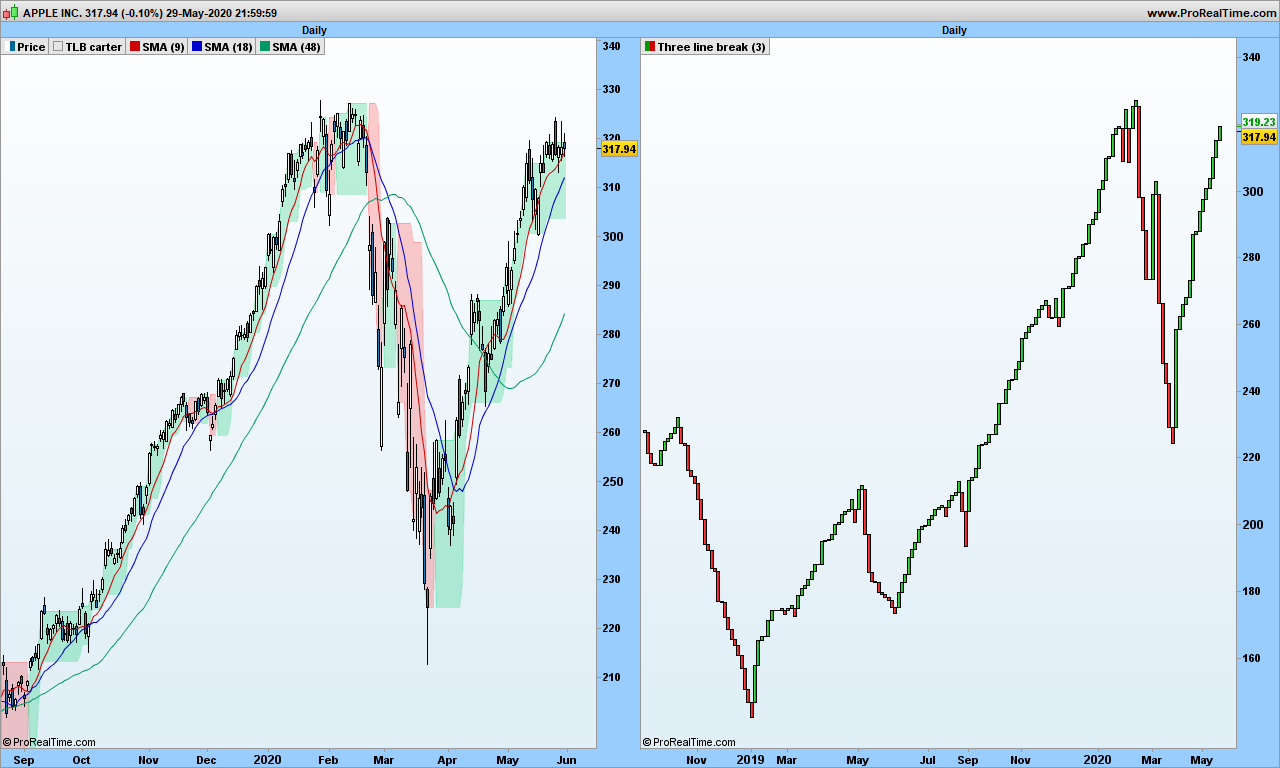
There are signals from TLB that you would obviously not take after adding our usual 3 single Moving Averages for instance.
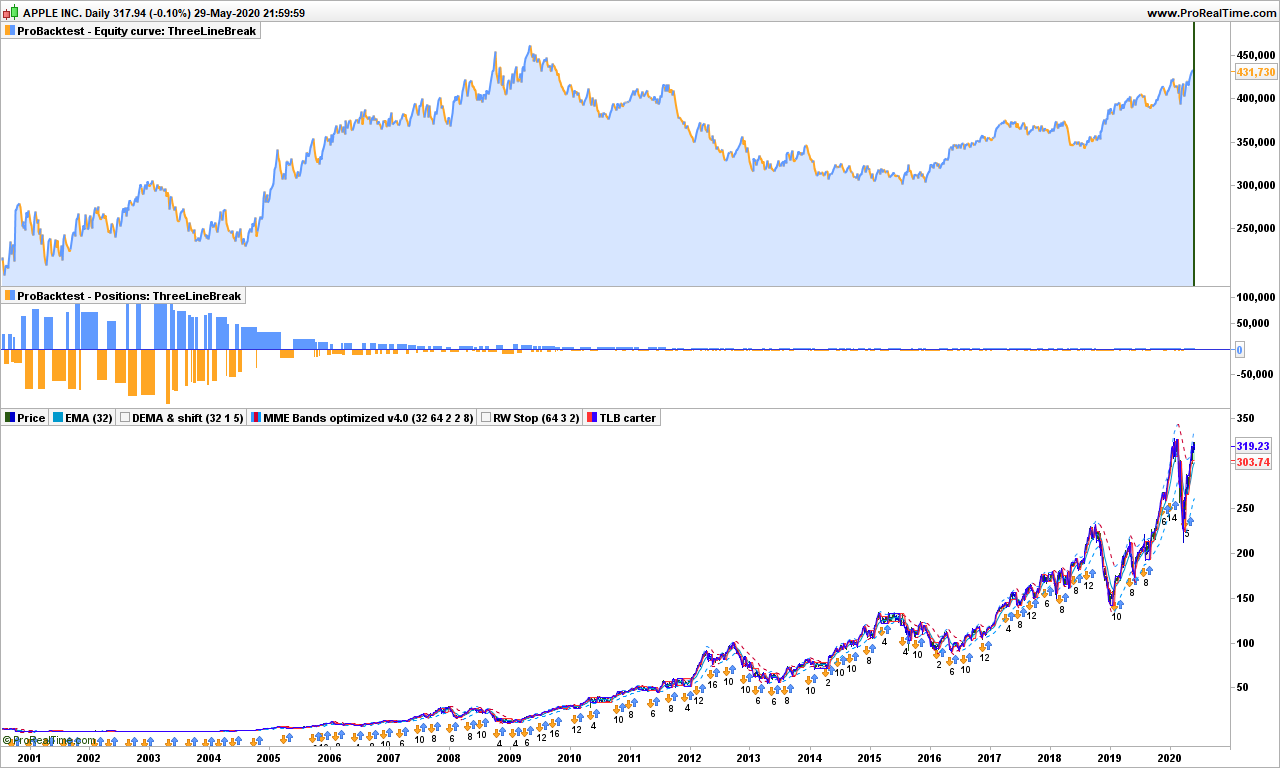
When we backtest over long period of time the TLB strategy on standalone only, we surely are disappointed.
Let’s look at Apple. First with TLB, taking buy and short signals, 300%
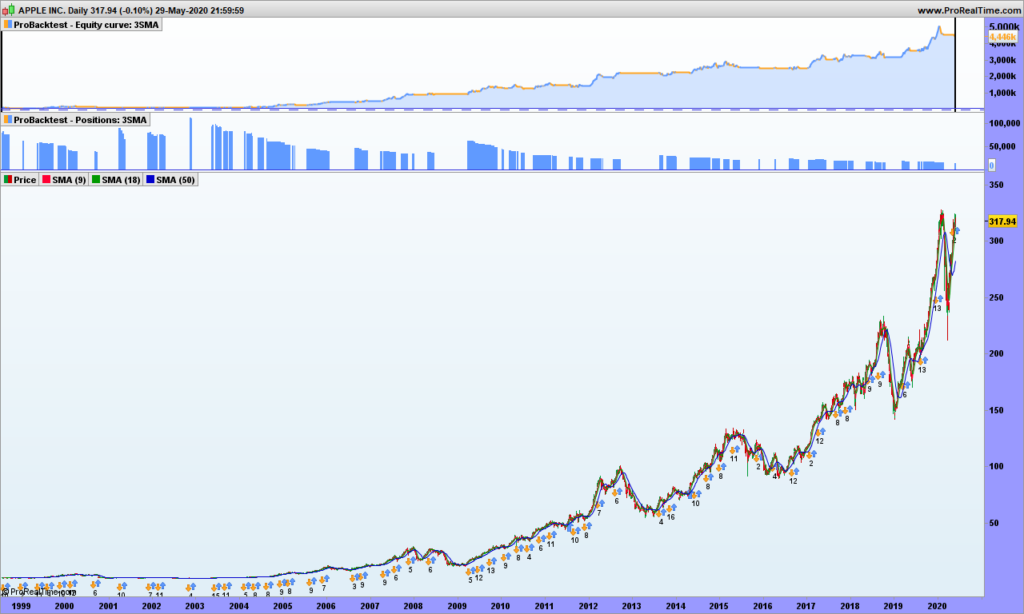
Taking our 3-moving averages on the long side only, we fare far better!
So if you hate candlestick charts, then you need to put those 2 technologies together. First add the 9 and 18 averages on on your TLB chart.
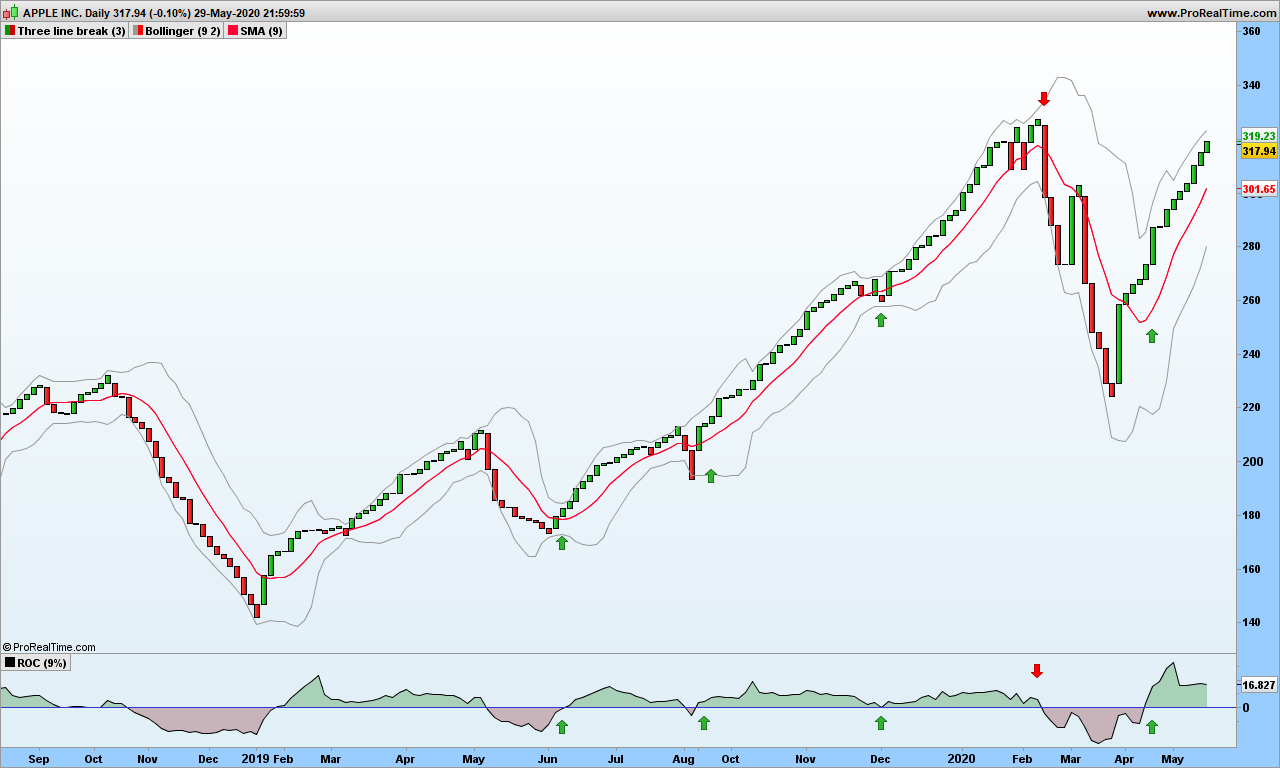
The size of each TLB line represents also the volatility, though you don’t know how long it took to have this volatility increment. Fair enough, the daily volatility is filtered out to show the trend volatility. The ROC indicator should be very talkative. I am displaying the ROC 9 days on this chart:
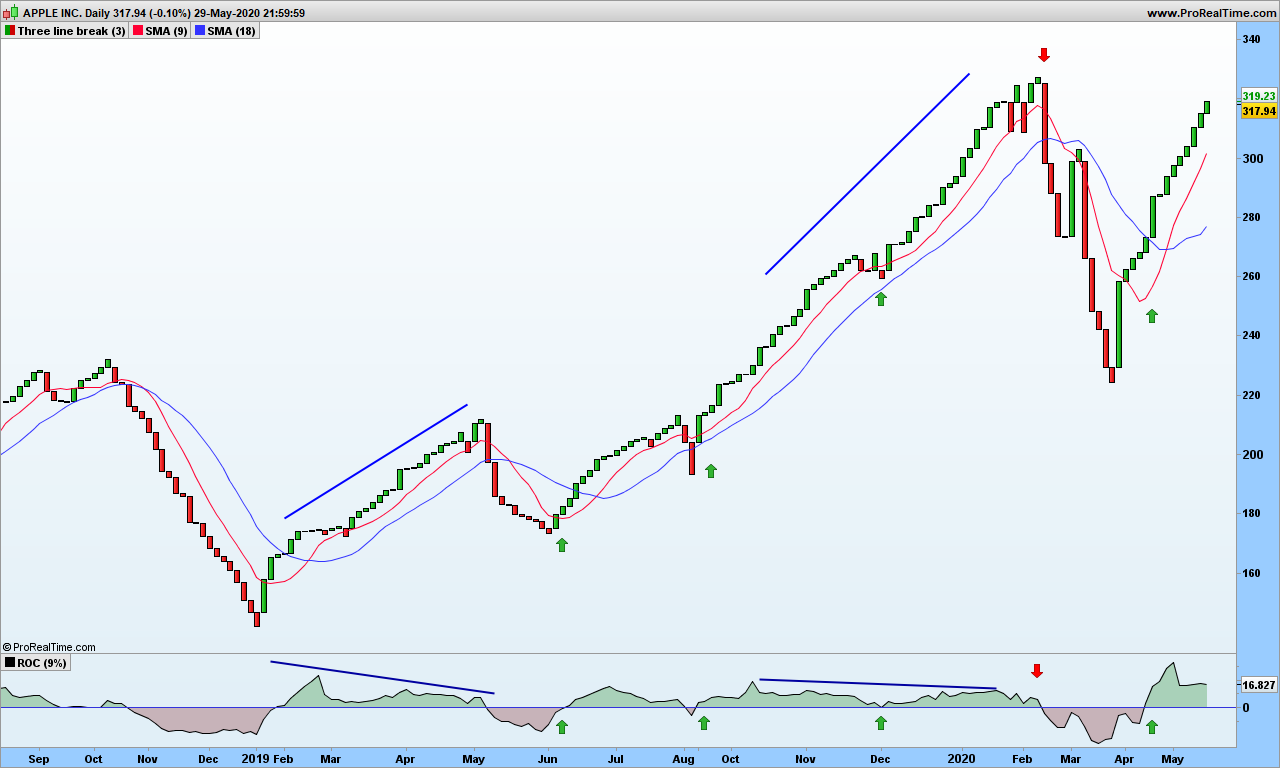
Any time, ROC crosses 0, or just touch down 0 and goes back up are good entry points. When ROC is positive, just filter out the short signals. An other confirmation is SMA9 is above the SMA18. And there are also divergences to help anticipate trend change!
You may also look at the volatility of 3LB, this time using Bollinger bands, because TLB lines stick to 2 standard deviations!
I tried to move back these good-looking curves to candlestick charts for back-testing but to no avail. So I can not show you the backtesting result.
As a conclusion, if you are not after option trading where time does matter, these TLB chart are a very good tool. Overall trend is given by a single moving average, which allows easy filtering of false signals.
That’s it. Until next time, trade safely!
I couldn’t refrain from commenting. Very well written!
Like!! I blog quite often and I genuinely thank you for your information. The article has truly peaked my interest.