I hope you enjoy reading this blog. Volatility trading is like being a dragon slayer, you are fighting the mythical chinese beast that is unpredicatable. This is emulated in some chinese martial arts school where unpredictability is key to win your fights!
If you feel comfortable presenting and exchanging ideas, write articles on this blog, you are welcome to contact me: dragontrader at vivaldi.net or randomerrance on twitter. Spammers will be barred immediately! I may have only a few years thinking advance but I believe we can make a killing on the markets. As title indicates, it is a club, free to join, free to leave, …
It is NOT allowed to post very detailed advice on which stock to buy or short. I will only post market analysis from time to time. As they say in WallStreet and in China, there are those who know and those who tell, and these are not the same. We want to be those who know and enlighten the path of knowledge to others.
Price action trading (between support and resistance)
Trend trading
Fundamental analysis
Volatility is hidden behind all these techniques but it frightens most people because we talk about noise, probability, leptokurtic distributions, and many more abstruse words.
Volatility is very easy to understand:
P(t) = P(t-1) + e
Where P(T) is today’s price, P(t-1) is yesterday’s price and ‘e’ is the delta between the 2. ‘e’ is the raw volatility!
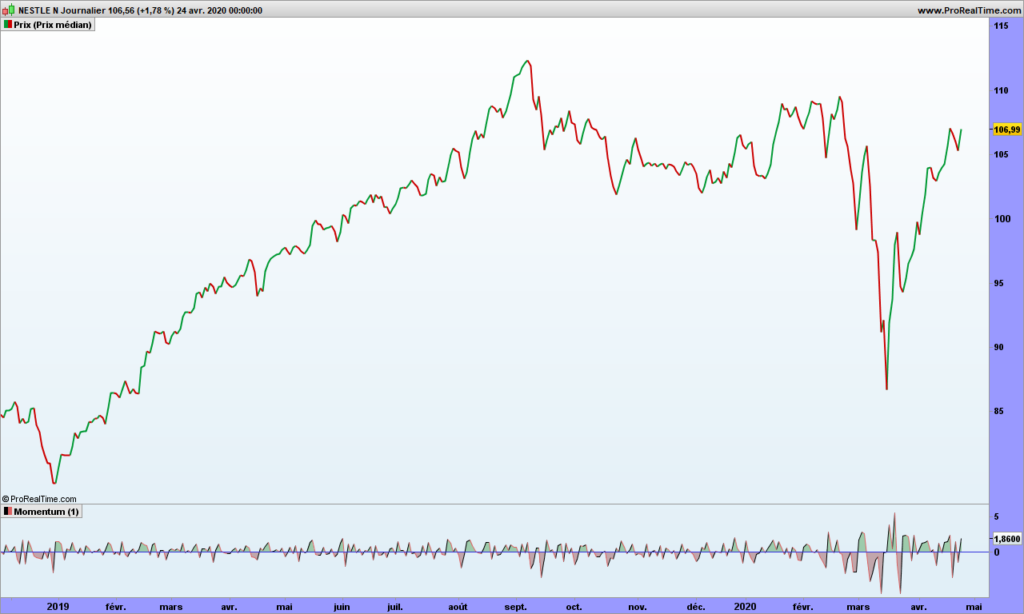
About price, we usually use median price of the day instead of closing price, to smooth a bit the volatility 😉
‘e’ can also be seen as the 1-day momentum. If ‘e’ is positive than momentum (speed) is up; if negative, momentum is down. This is the beginning of a trading strategy. Don’t throw away your other indicators just yet, because this not usable as such! (At the very least, consider the weekly 1-week momentum and take only signals in the same direction, but the signals can unfortunately be used only in intra-day type of trading)
Interestingly enough, should you program the formula above on a computer using random function with ‘e’ representing anything between 1% and 2% variation up or down, and run 10000 loops at least, and display the results, you will see a graph that is looking very much like the graph above. You will notice support and resistance lines, head and shoulder patterns, triangles, … because you have learned to recognize them but these are mere illusions! Because these patterns can be generated by a very simple program, the conclusion is that they have no predictive power! Or in other words, it just means that if a supposed target is reached, it is purely by chance.
So you are now left with ‘e’ and you can do whatever makes sense to you. You can average, look at standard deviations, look for hidden frequencies with Fourier transforms, …. Remember to keep it simple. When some big pocket start to sell, everyone sells; when price start going up, nothing happens until the hiking is obvious, so there must be some linear component. Which we will see in an other post!
All the content on this website will be original. No lessons about Bollinger bands or how Average True Range is calculated. This first post will reposition volatility trading with respect to other kinds of trading.
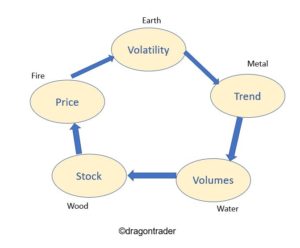
For this purpose, let’s travel east to reach China. They have theories like Yin and Yang but the one that interests us more here is the 5 elements theory. According to it, plants, humans, animals are all driven by a cycle including 5 elements: wood, fire, earth, metal and water. There are 2 cycles actually, one for creation and one for destruction. The market being driven by humans, and robots are programmed by humans so are no exceptions, this cycle to market themselves!
A stock has been issued by a company, this is the wood. Then wood generates fire, price is matter of hot arguments we need lots of computer to finalize. The way prices go and up and down each is volatility, it is earth, it is linked to muscles, so the market is shaping up. Then from the volatility appear trends, which is kind of illusion that prices are going in one direction. Once trend appear, volumes change; volumes are like water of the river, they make the market. When price goes up in a trend, then volumes go down as nobody wants to sell before the trend is over. Volumes in turn change the company; if lots of money flows in, then they have capability to invest and this in turn will change the price of the company. Cycle is over!
From a trading perspective, you can position yourself wherever you want:
At stock level, traders carry out fundamental analysis. Their strategy is usually buy & hold and they want to catch dividends for the money you invest in. They don’t usually care too much about the actual price, saying it doesn’t matter. They come up with funny price objectives by comparing with other companies in same sector and when the stock plummets, they say they keep it for long term!
At price level, traders are usually day traders, order book traders, robots… They draw lines which they call support or resistance. They of course totally disagree with one another, given they are not looking at the same chart with same time frame.
At volatility level, there is … almost nobody. Nobody is pure volatility trader. People hate volatility (subject of another future article). Bollinger himself agreed his bands are far from perfect. Keltner also paved some way. This area is still not much explored. The point is you need to ‘see’ things in all this random data that is the market. It gets lots of convoluted mathematics to play here. But the rewards are great
At trend trading level, one will meet sour guys. Why? Because they are blamed any time the market plummets, as they openly say they play both upside and downsides of the markets. They may have low success rate but when they win, they win big, and so an overall positive expectancy
At volume level, traders have lots of money to manage. So they can call the company’s CEO and advise on the strategy or the volumes might just die, right?
That’s it. There are times when you need to trade price level (sideways markets), other times when trend is a better choice , or dividend playing at some other time. We need to get an edge to enter the market and to exit.
Until next time, trade safely from the right perspective.