Undistorting investing reality at the speed of light!

I am sure you are wondering what I am going to talk about with such a post title! But let me start by asking a question: Can you tell me what is speed of light with good accuracy? I will be back after this break:

Whatever answer you give me (ideally should be: 299792458 meters per second), what I did is just awake part of your brain that deals with math, physics, … or intelligence to summarize. It is very important for next question:

Why do you invest your money for?

  1. To save planet from crazy climate evolution
  2. To help companies being more socially responsible
  3. To make as much money as possible
  4. To help out spot aliens if case they come to vicinity of earth

See you can not lie any more to me or to yourself, the only possible answer is number 3. Your brain orders you to take that answer.

Now think about you last meeting with your banker (didn’t I write bankster?). You were surely told how we need to build a safer and green planet, how it is difficult to have profitable investments…

Had your banker started by asking you my initial question, the meeting would have much more complicated for him, you would most likely have told him “give me 10%, I know you can do it!”

Can he really do it? Not in straightforward manner but short answer is yes. The theory is simple. All the countries will need pay for the money they have printed for the pandemics, and the way they will do it is by applying deep negative rates to accounts, maybe down to -5% or -6%. Whaouh! <Add more interjections here!> It will go slowly for acceptance by people but it will happen. But wait, here we are discussing treasury bonds! When interest rates go down, the price of bonds goes up. When the rate is down by 1%, bonds prices go up by 6% or more!

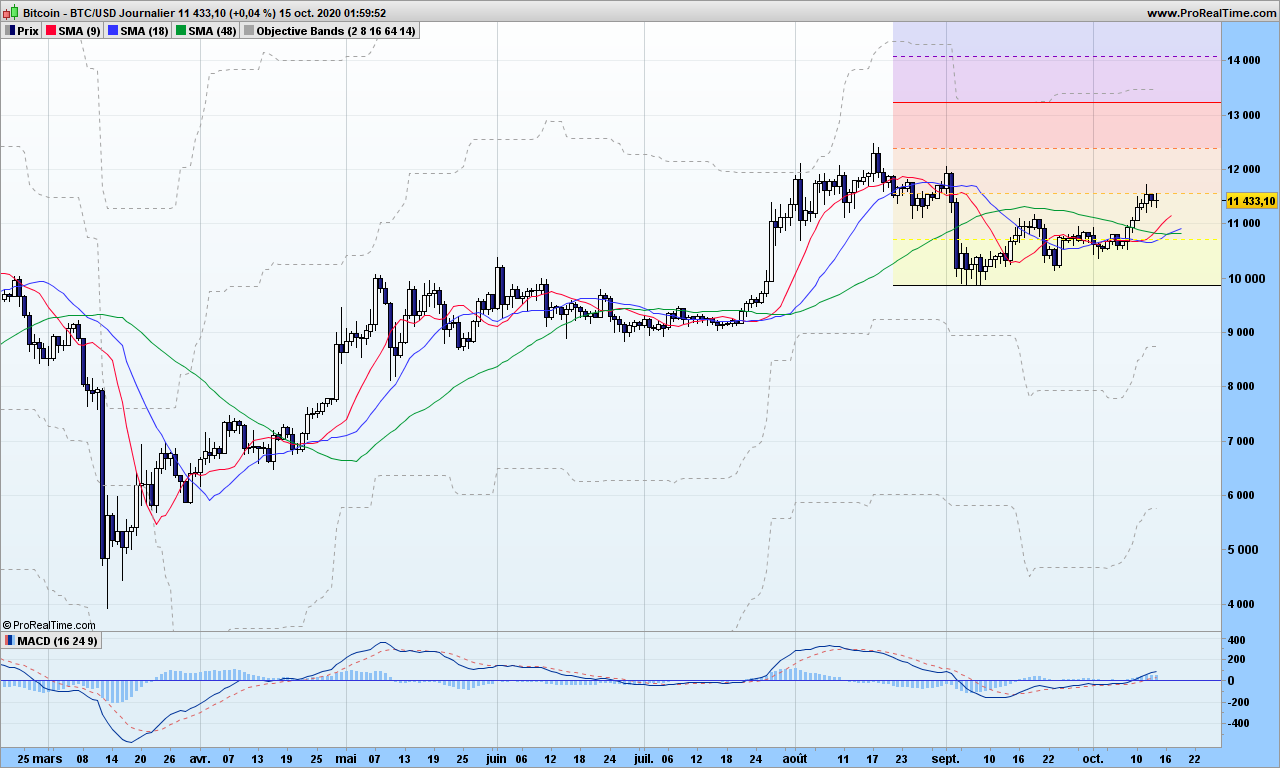
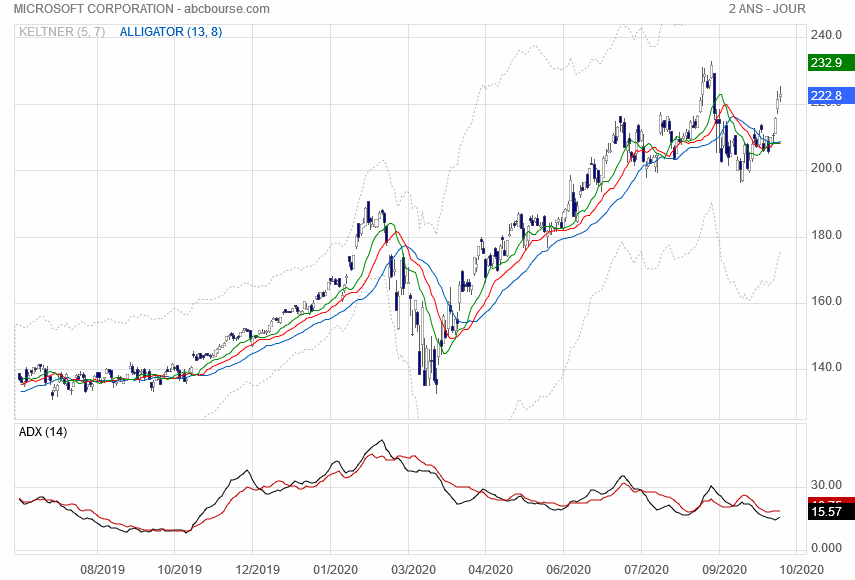
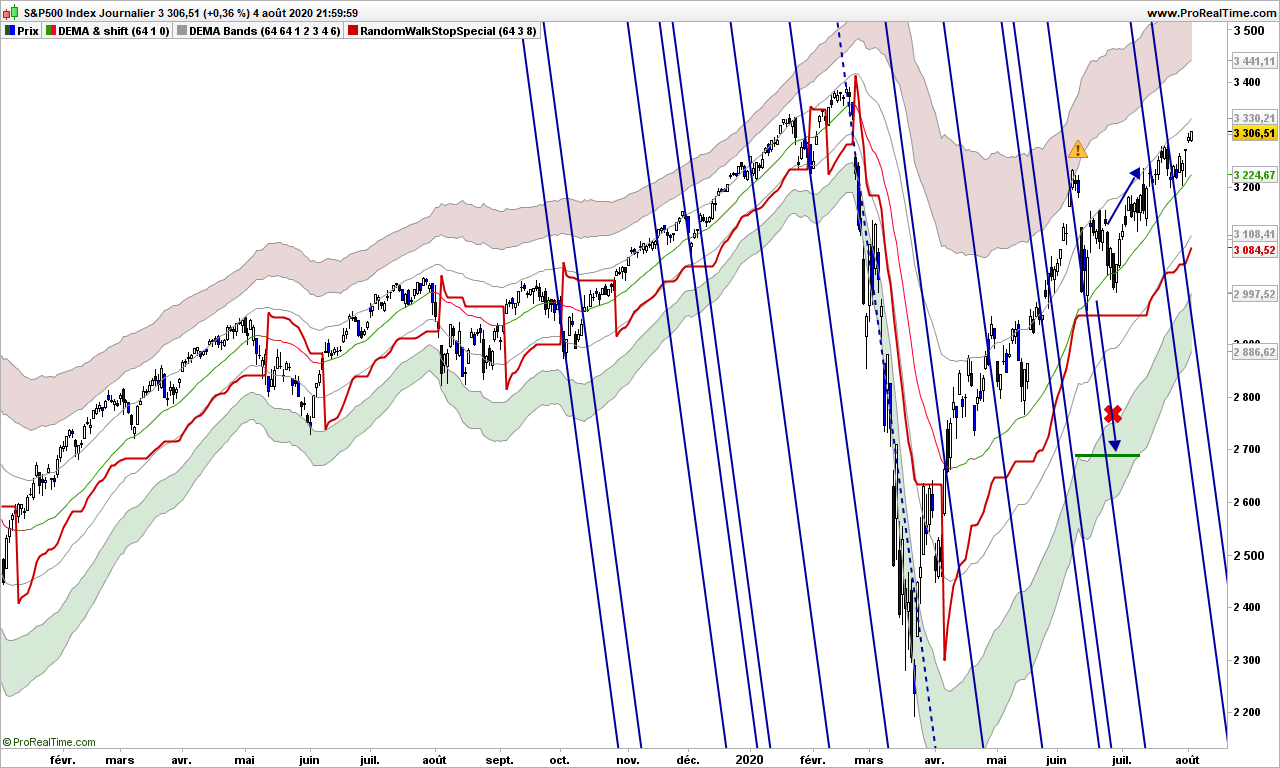
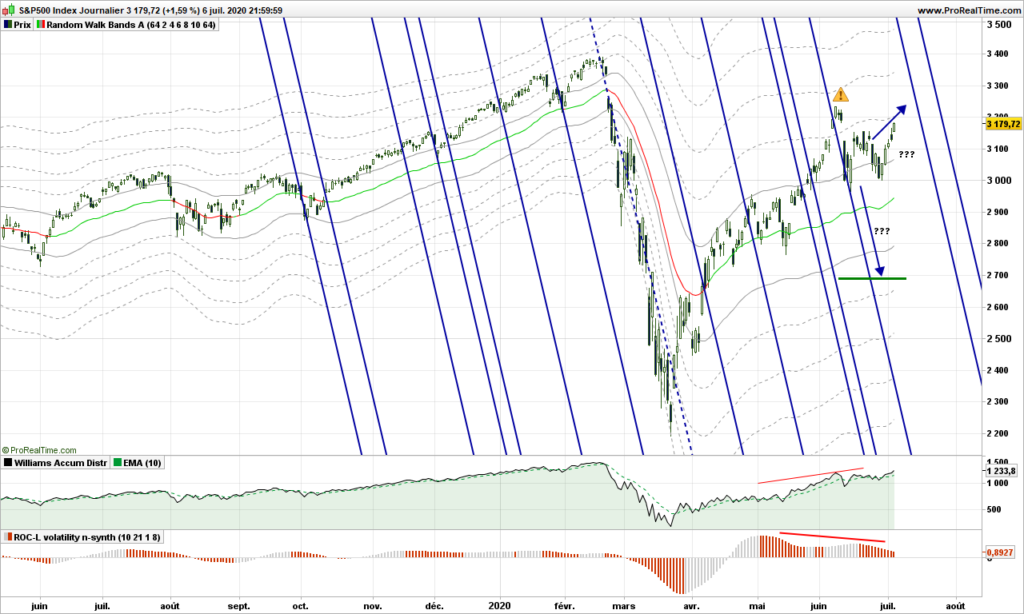
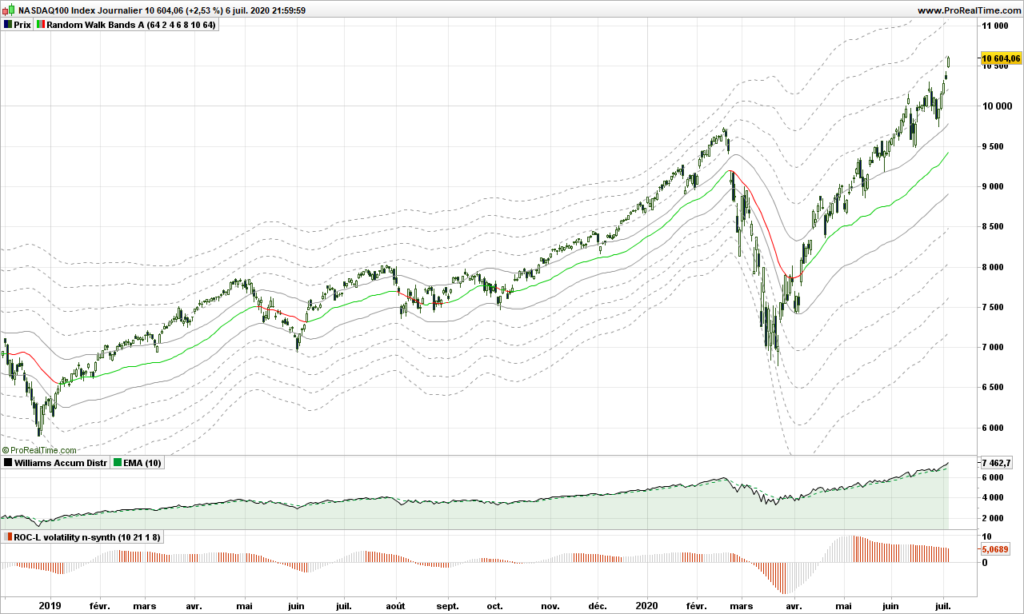
See that one graph below (US treasuries bonds futures). While your bankster now charges you negative rate, he invested your money in treasury bond, yielding a cool 29% over the last 2 years, 9% for 2020 YTD. Ouch, that hurts!

Now go and see your banker, ask him to put treasury bonds in your portfolio (of course, consider there is some risk level involved here), keep as little cash as needed if you get negative rates. Enjoy the face that your banker will make! Especially if rates go down, deep down, very deep down, …

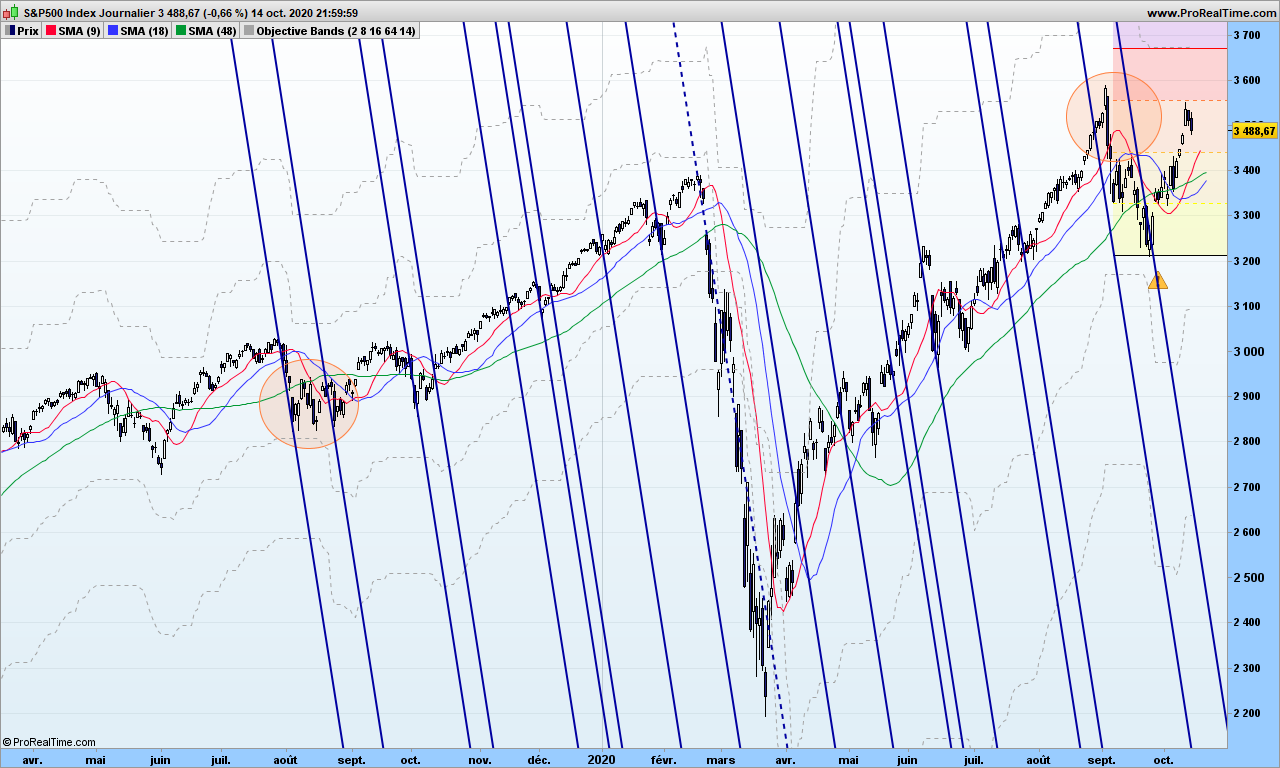
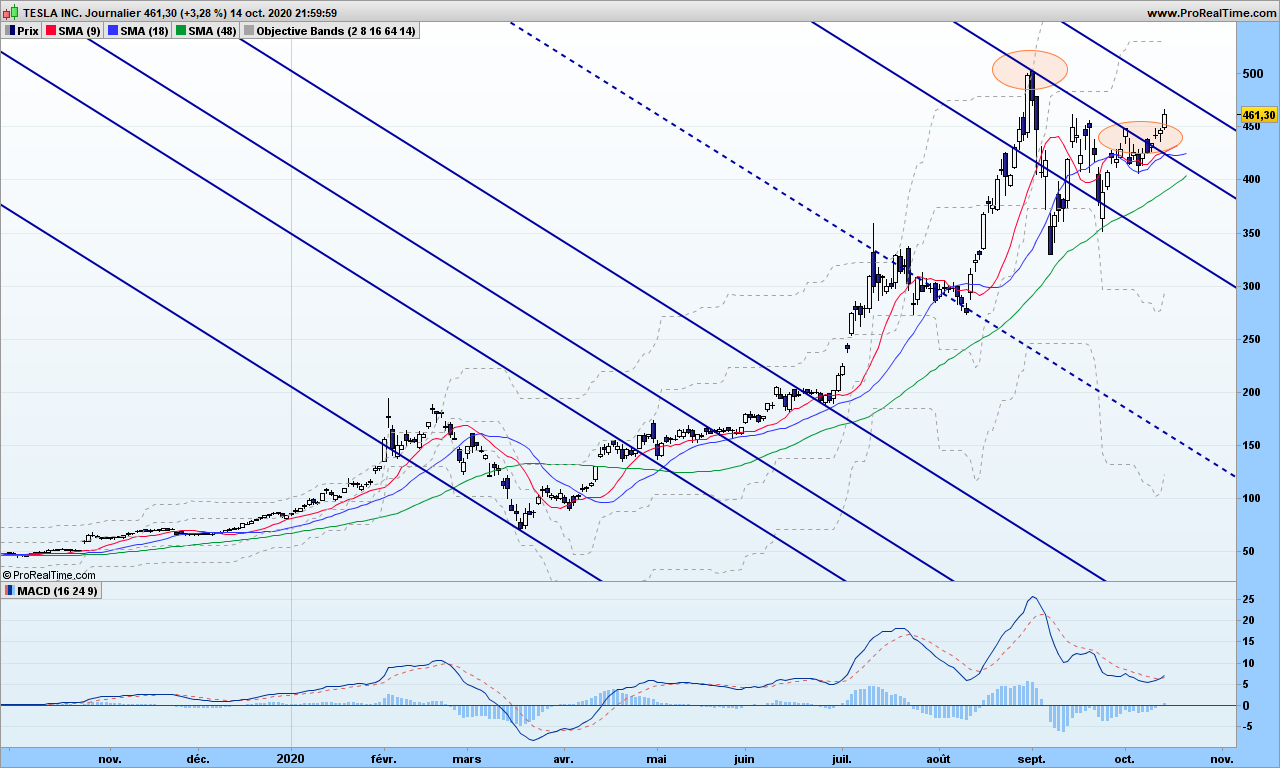
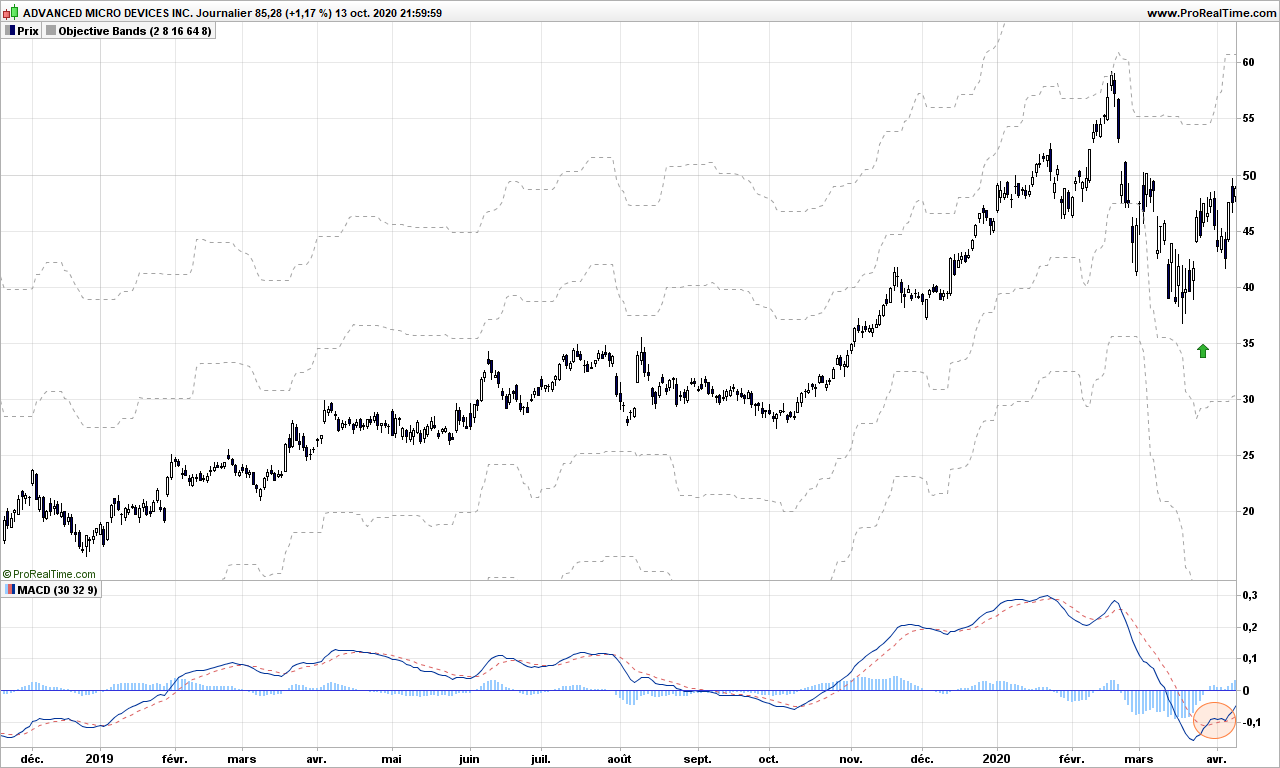
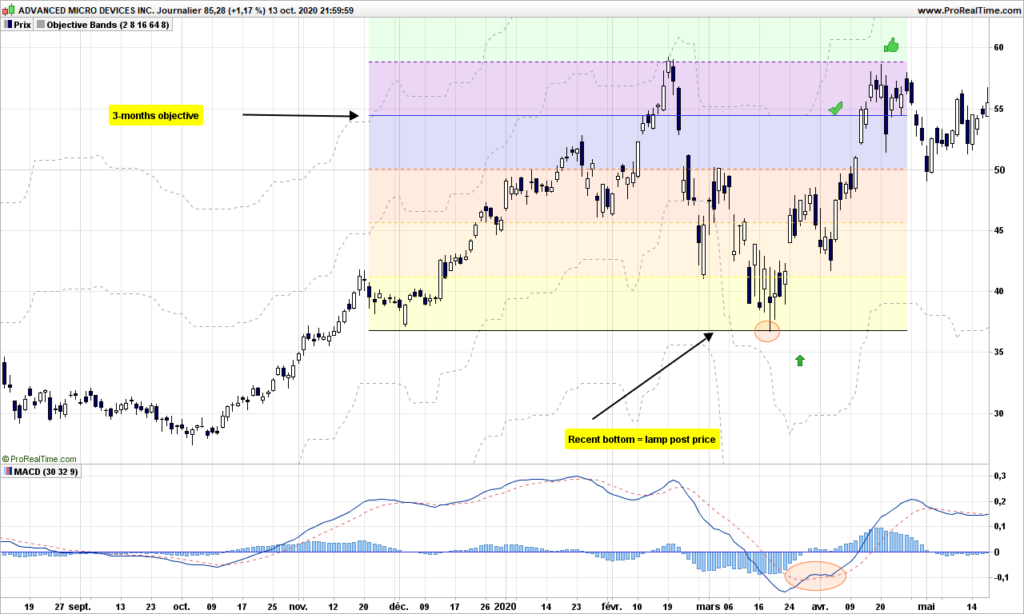
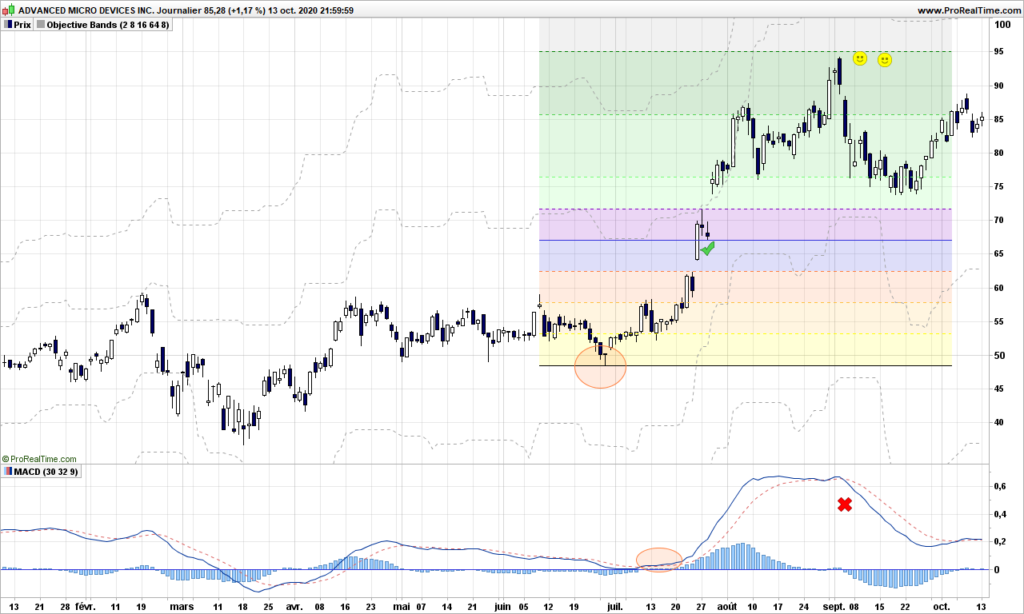
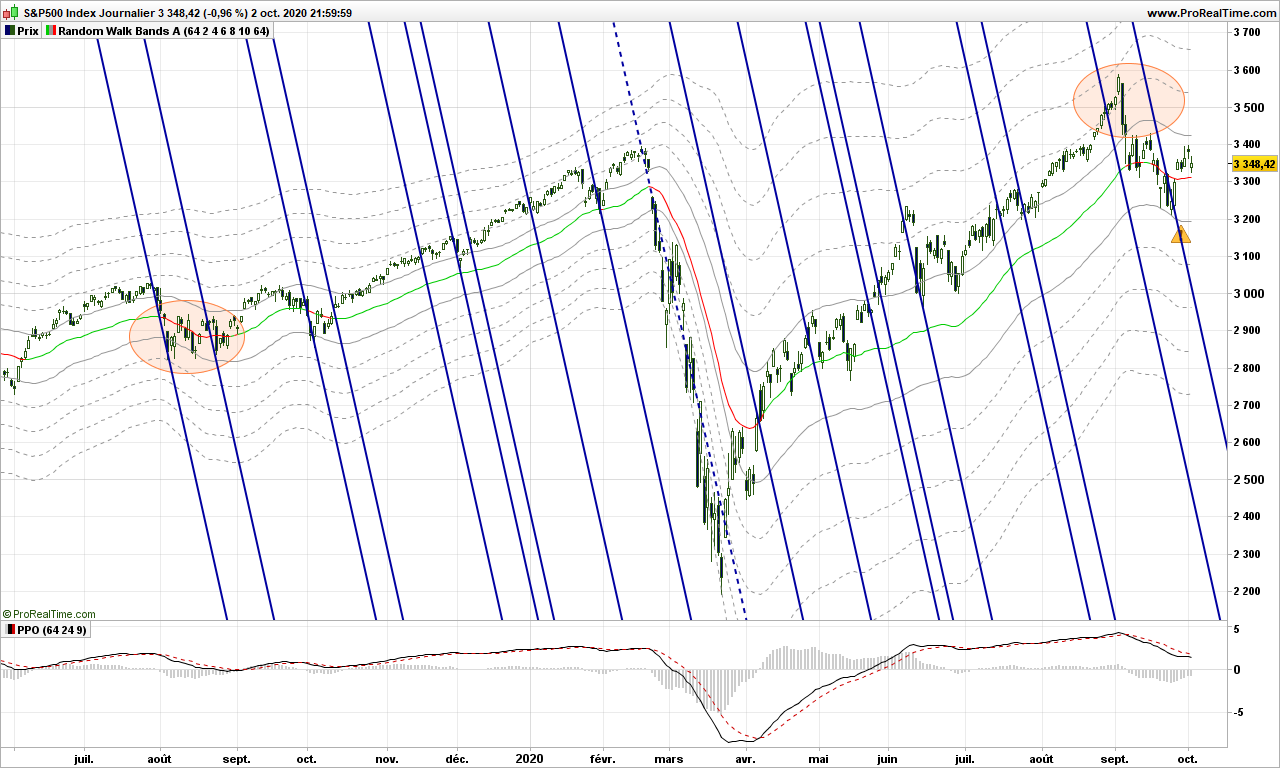
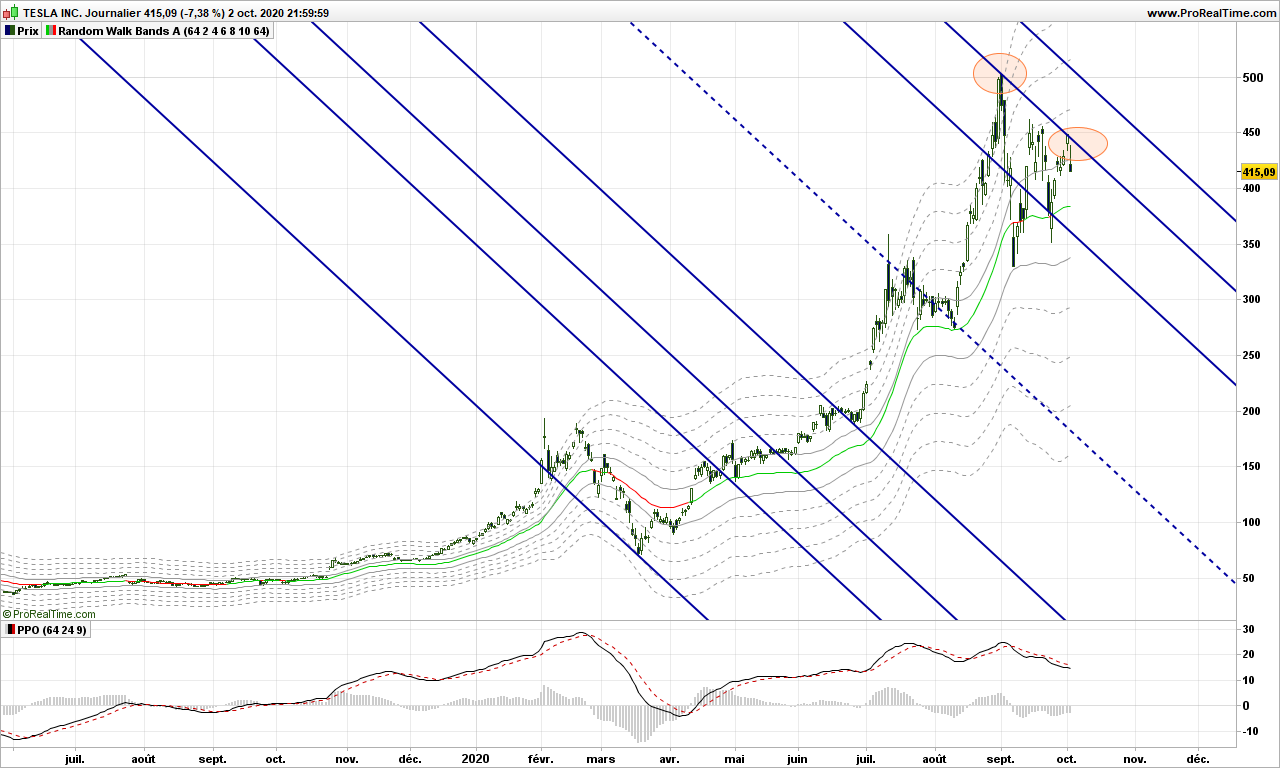
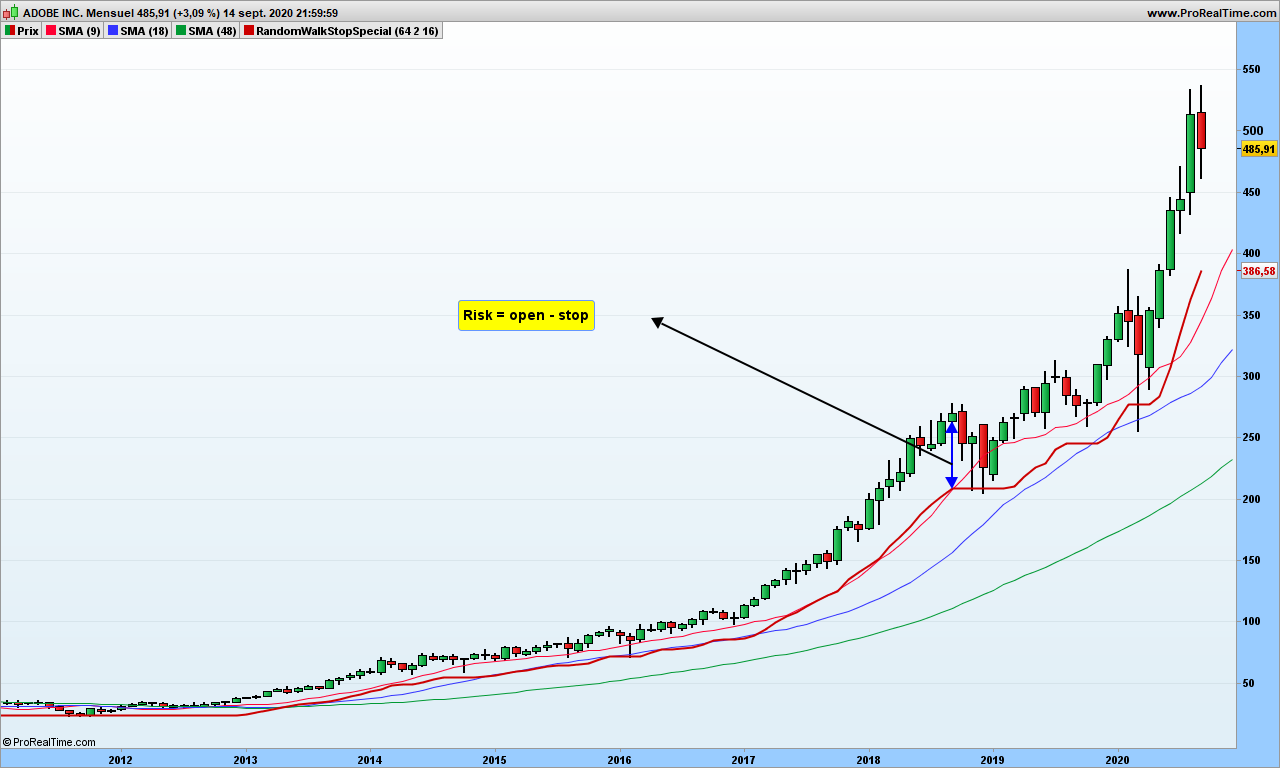
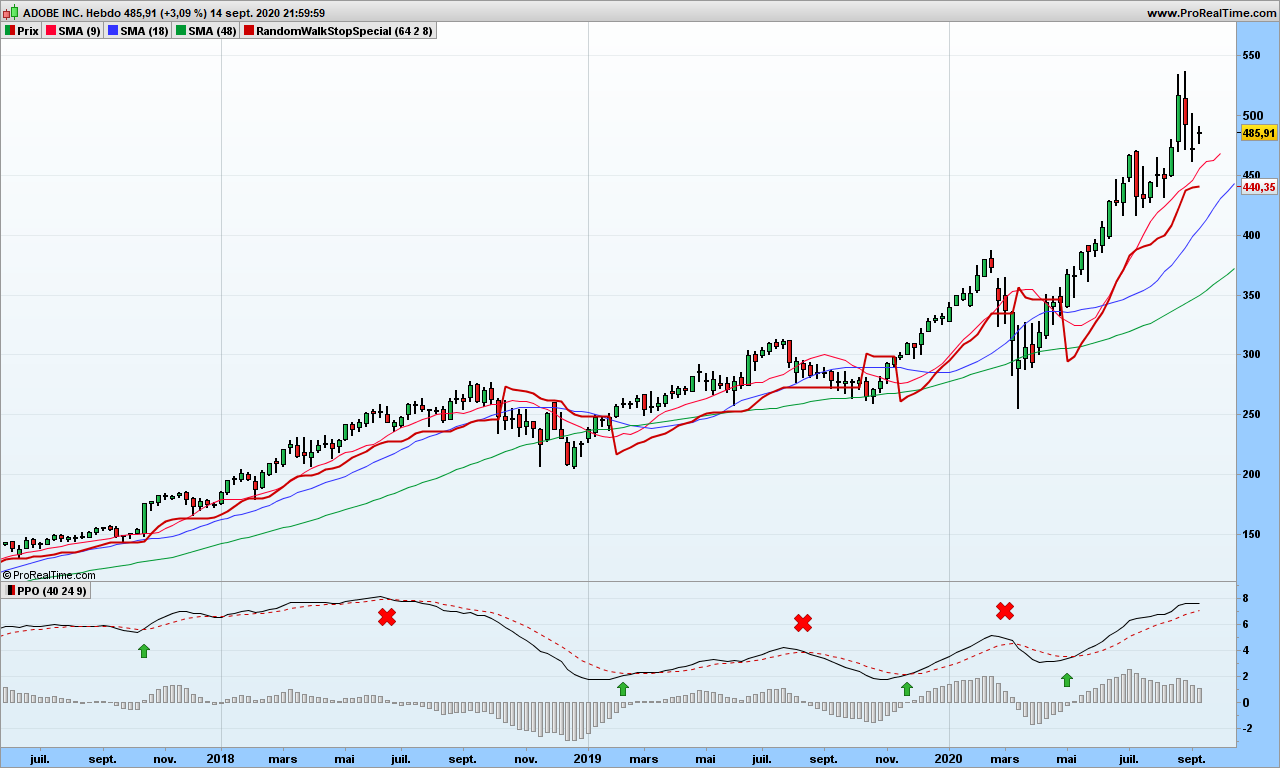
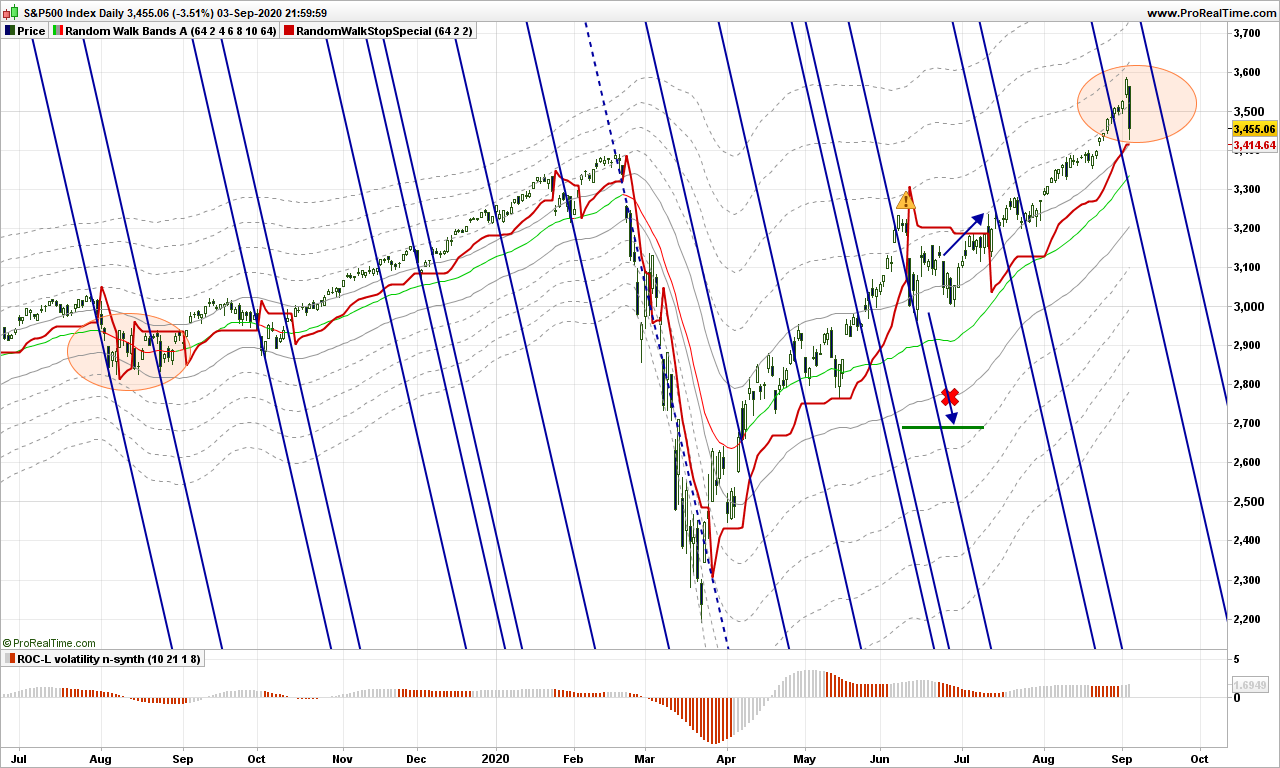
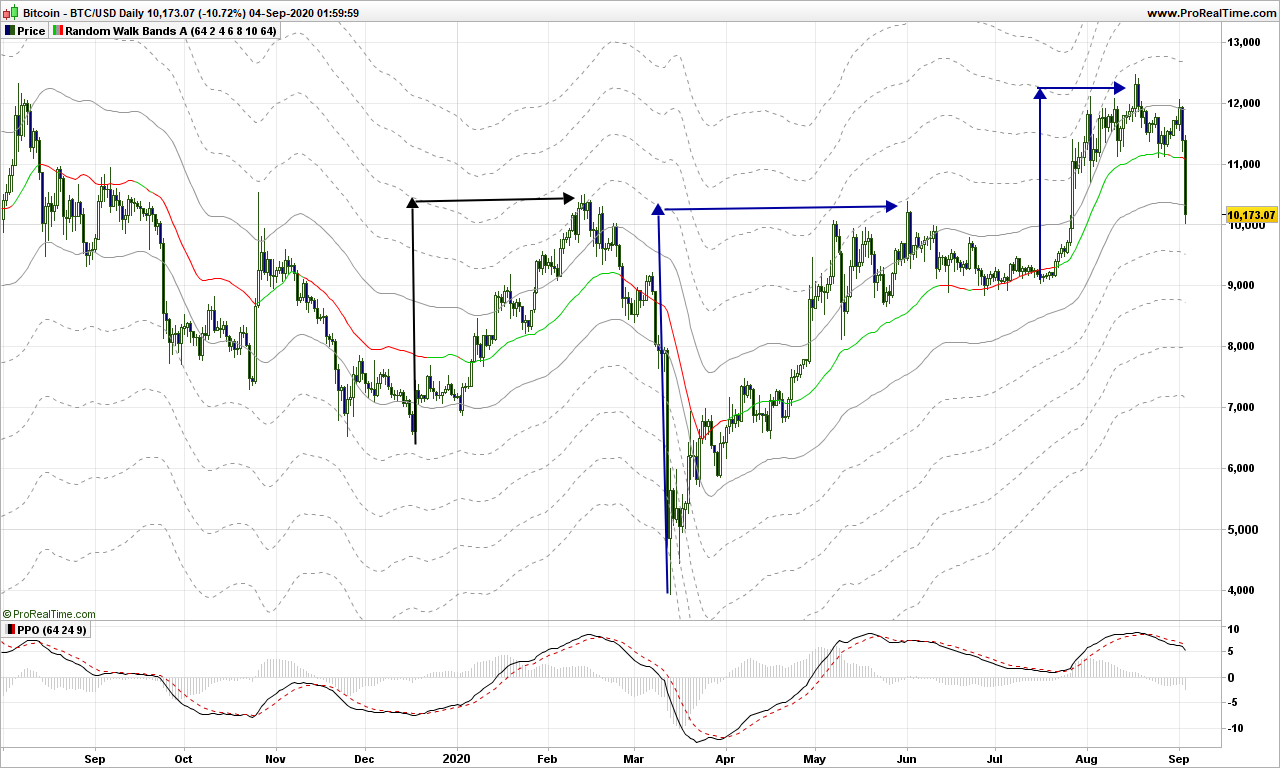
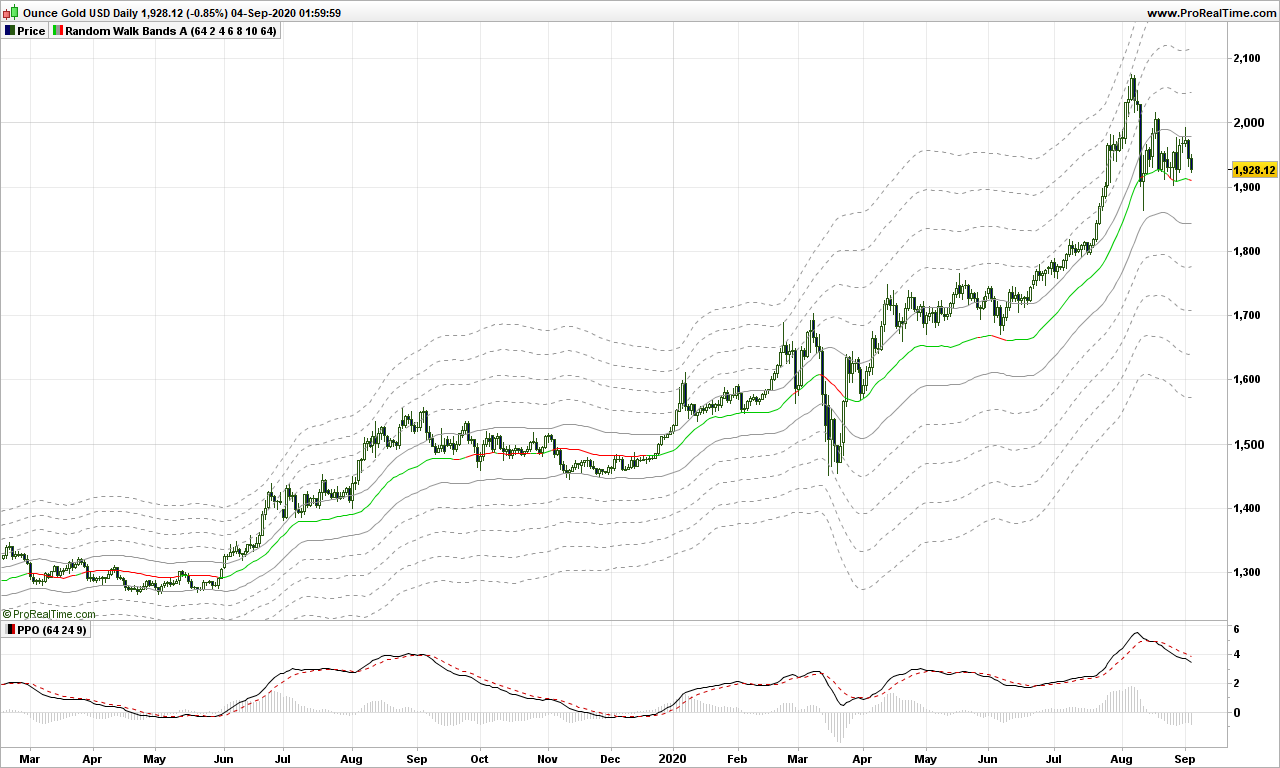
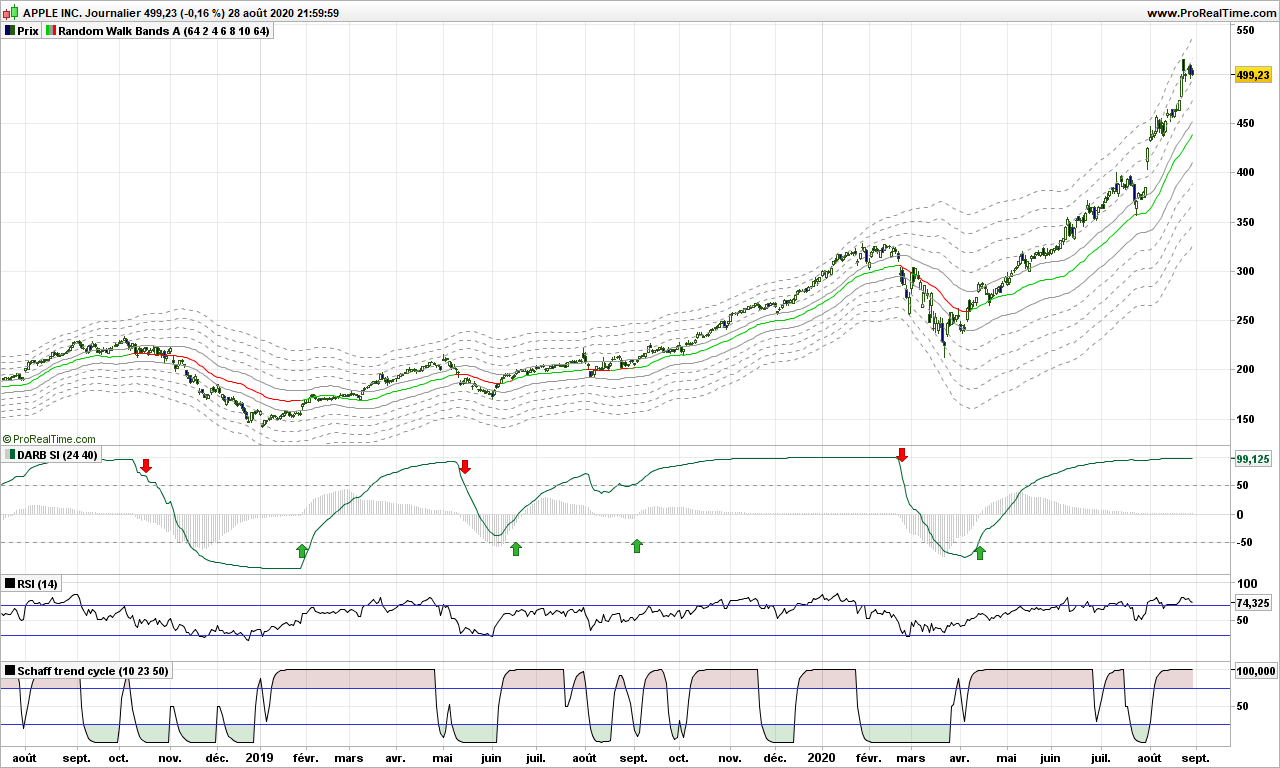
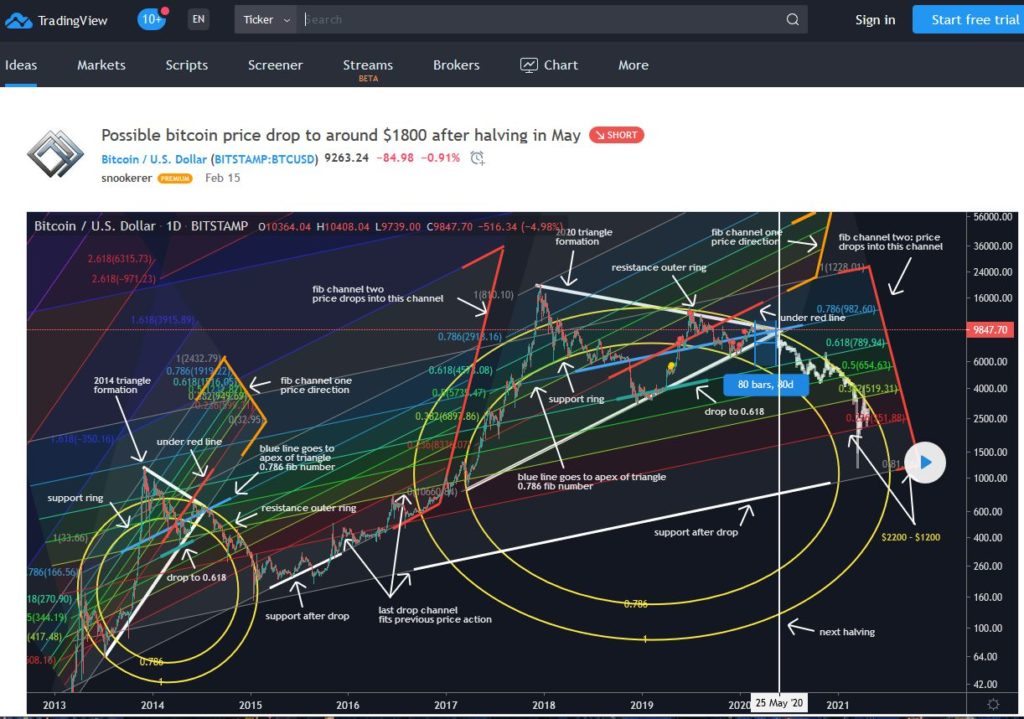
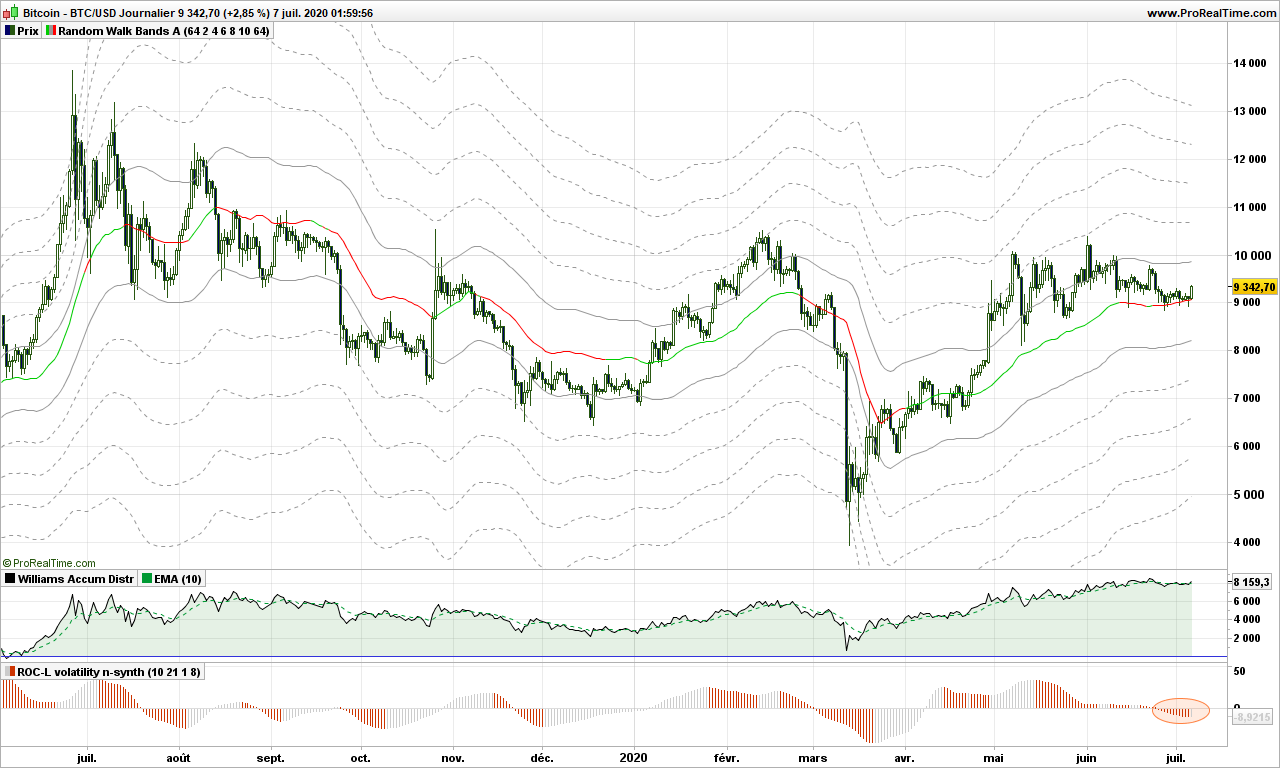
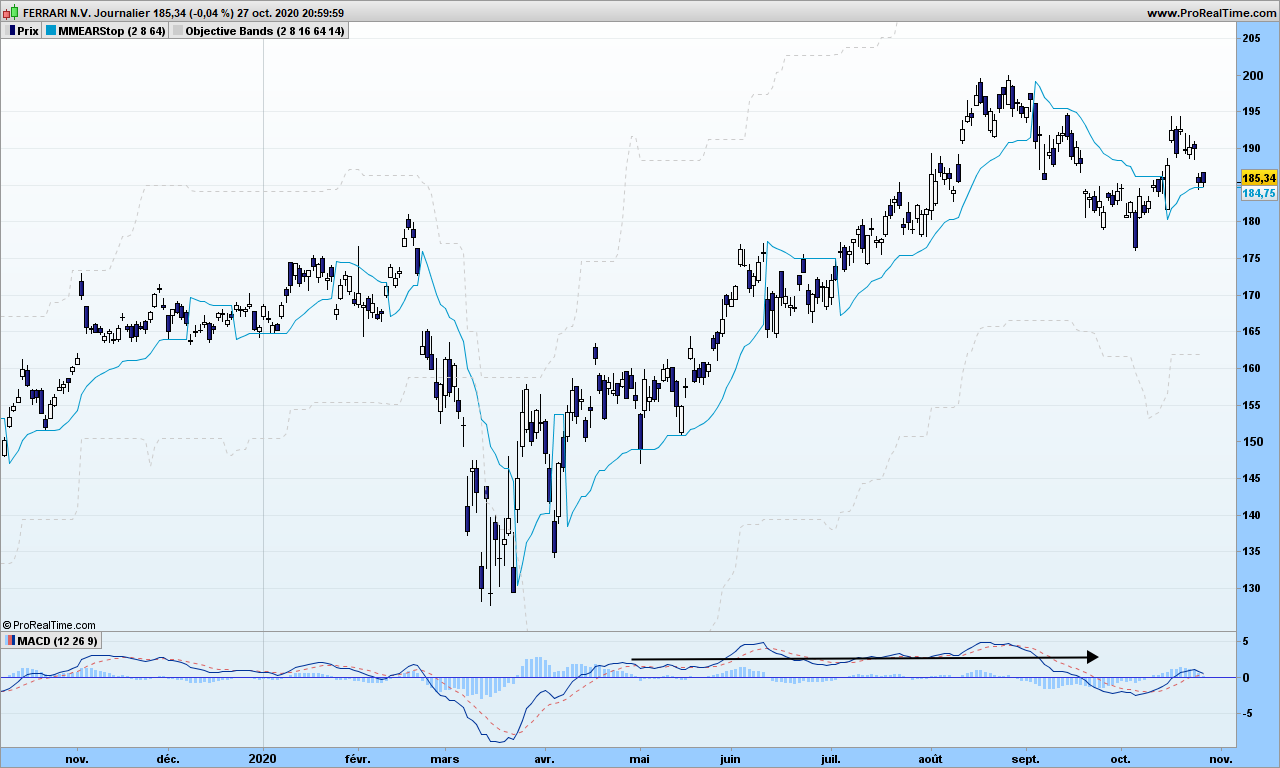
The same goes for trading. You are told to use indicators with preset parameters recommended usually by the guy who created it. I have explained many times the fraud that the Gaussian distribution is, it actually causes distortions of reality. Indicators are the same: they let you see the reality through a specific prism, and if they are not based on sound mathematical principles, they will mislead your investment decisions. The popular MACD falls into such category (I will let you look at the formula), though it might be efficient when used in specific market conditions but also with right parameters. See Ferrari below, MACD with default parameters is flat for most of the growth this year:

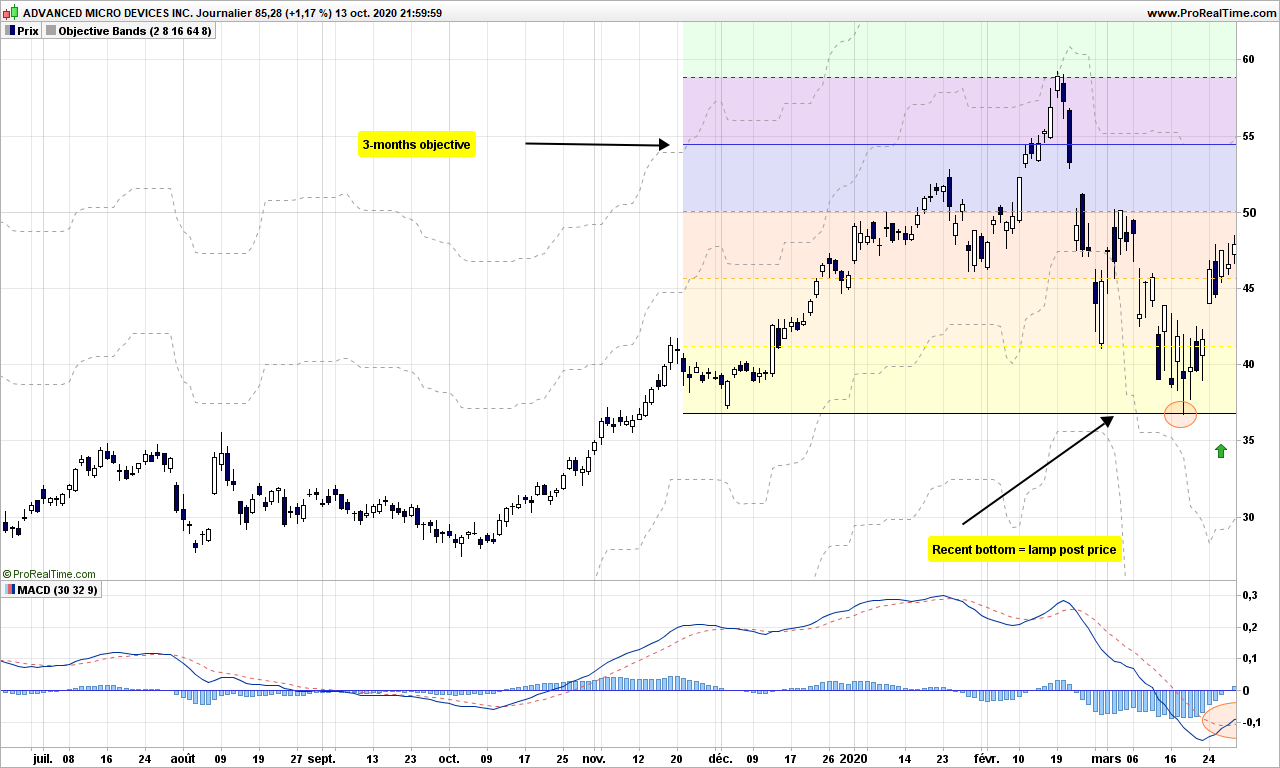
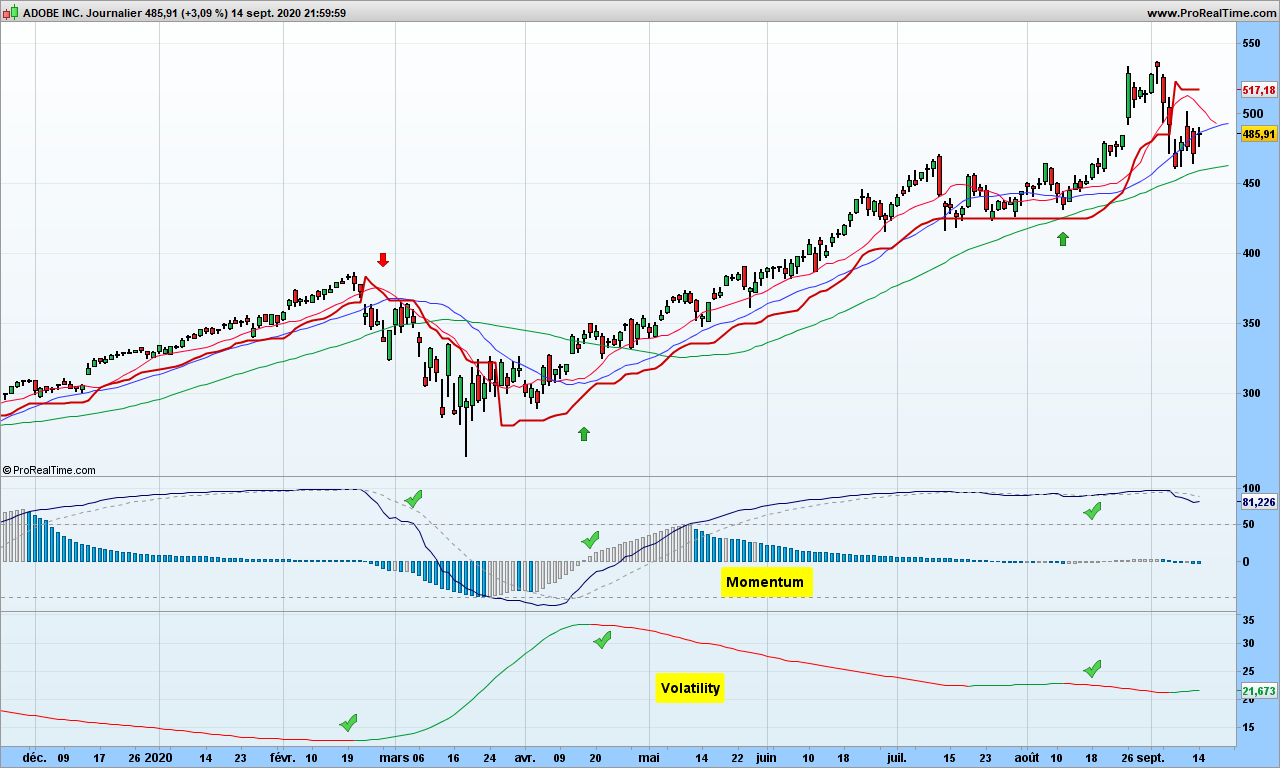
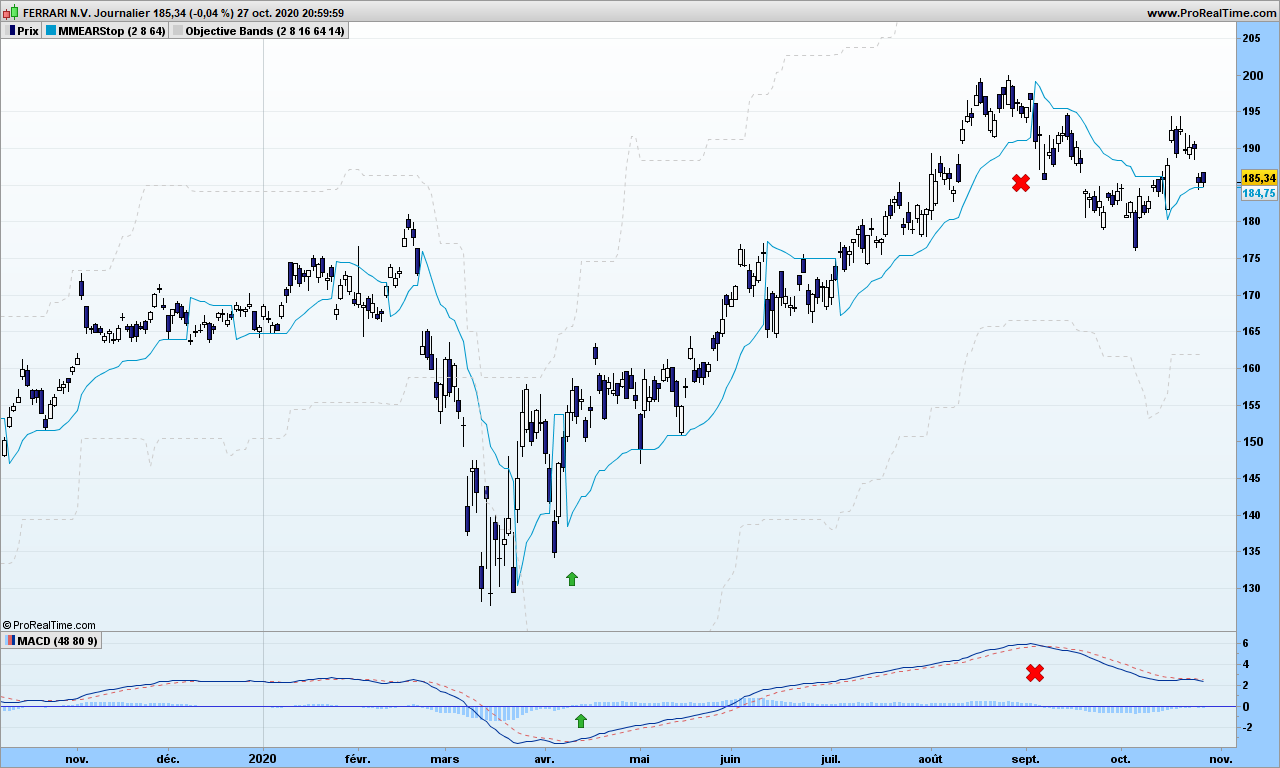
As mentioned many times, an investing or trading action must be linked to an ‘observation’ period. You want to earn x% over the next y months. The parameters should be set in such a way that you can follow your trade easily : entry point, target price, exit time. Say I want to capture most of the up trend over several months, I change the default parameters to 48 and 80. Look at MACD now, close to perfect!

It does not take too much intelligence to uncover a trading strategy that works. Just wake up your brain by wondering what is the speed of light!

That’s it! Until next time, trade safely!

The boring market report – October 15th 2020

Amid sad jobless figures and coronavirus new travel restrictions in Europe, markets may be in a strange mood but money flows by billions in stock market because bonds have ridiculous or negative yield. Interesting? No. This is noise. All this does not explain why you, as an investor, will pull the trigger to buy Apple or Tesla stock. Those so-called correlations between news and market are complete non sense!

Let’s go back to our sound mathematics based trading!

S&P after crossing reaction line in now back up, see how good those reactions lines to find bottoms (which you can’t play of course!). As explained in yesterday’s post, new 3-months objective is 3672, we are already 6-steps from the bottom, which is quite good. Indeed the tail winds may push prices horizontal for a few days, but next reaction line is far away, do not expect a reversal in the short term. No need to say you need a stop anyway, this is trading, not betting on the wind direction!

Tesla, after hitting twice the reaction, has gone through. Next one is very close, so better be careful!

Bitcoin: does anyone care about Bitcoin anymore? Maybe you should! Next objective is 13230$, which means the gain for 2020 could be close to 100%, compared to current 10% on S&P500, before the US election…

That’s it. Until next time, trade safely!

To trend or not to trend, that is the question

Today we are going to study how trends transition to more or less flat markets and how to position ourselves for the best!

I am sure most of you are already familiar with indicators which supposedly indicate when a market is trending, and when you would be better off sleeping and out of the market.

Moving averages are close to be one of best indicator for that purpose. See that graph of Microsoft with Alligator indicator. Note ADX indicator at the bottom does not indicate too much!

The truth is investors are either having the same opinion at the same time and there will be a trend or investors disagree and market ends up being choppy and overall very flat. So any time that you see what could be the end of a trend, switch to drunkard mode and start counting the steps! If you need background information, please refer to this blog post.

Sure enough you could wait for prices to cross Alligator lines and then that colors are in the right order, … then you may have lost 50% or more the big next move! You need think differently. Don’t worry, I will skip the action-reaction lines for today!

First step if course to detect the end of an existing trend (at least 2-3 weeks long), you can use MACD crossing over its signal for this purpose. See this example with AMD:

What the heck am I supposed to do here? We are obviously leaving a short down trend and we don’t know where market is going to go. Nobody does unless you can dig into the brains of all investors at the same time!

Again we assume the most recent bottom is a lamp post, from where our drunk guy is going to walk northwards, maybe in trending manner or in random hesitating steps. But we know about the objective he can reach within the next period of observation. This is the first dotted line above the candles. In this example, it is 8 steps away and we are going to draw lines every 2 steps.

Now we are ready, the 3-months objective is roughly 55$, you need to use a convenient stop to protect and dimension your trade. See this post for instance. Let’s accelerate the time now!

2 weeks later, objective is reached (8 steps), the drunkard makes it even to the 10th step. From there, market reverses, a new long trend does not really pick, so you can do the exercise in opposite direction:

This time the drunkard does not go beyond 4-steps and after 3 months, you need to give up your short play. Then MACD goes again above signal

We reach first objective within 3 weeks, but this time the trend continues reaching 20 steps. You have successfully mixed together trending and random action!

That’s it. It does not need to be complicated. Don’t forget to choose stocks or indexes that have the capability to trend. Until next time, trade safely!

The boring market report – October 5th 2020

Sorry it has been a while since last post, I have been busy with the Cozy Dragon Research team about their discoveries. Digging in the data, and starting from the fact that Gaussian distribution is a scam for stock market data, many doors keep opening in the way we analyze this data. Exponential distributions are key of course, but even then as we focus on longer time analysis, we find that data is spread is in many populations, themselves are within an exponential distribution! There is therefore a fractal statistical Laplace structure. We can identify clearly what some call the smart money, then the money of everybody, and it all reflects the opinion diversity…

Let’s stop on that and come back to real market, where our goal is of course to make as much money as possible!

Unlike those waiting for Fed money, we want to profit from market meanders. The proximity of US elections, and Trump having caught COVID-19, and … Nothing gives us better indication that mathematics.

We left S&P500 between the last 2 reactions lines, and I told you it was mirroring the end of summer 2019. The move was much more violent this time but as you can see it ended exactly at next reaction line. The weather should be more quiet from now. The trend is of course still very bullish.

Nasdaq is same configuration. Those would wanted a strong correction will need to wait some more!

Our friend Tesla is blocked by a reaction line but bulls are still pushing to go through.

We can not anticipate of course what the many investors have in mind. Maybe Trump will recover from the virus and win in a landslide, in which case, the bull market will continue and take a deep breath after November. Maybe Biden makes it to the White House and many will go short on the market. A down wave is surely to be expected, but the exact timing it is starting is the biggest question. Not just now…

That’s it! Until next time, trade safely.

The boring market report – September 18th 2020

Volatility is still quite high out there, so the chances of big downfall are somewhat limited, … but non zero!

The graph of Nasdaq will show it all:

There is a nice divergence with WAD2.0 indicator and my personal indicator indicates a correction is already taking place, which is true. But before taking a position, you need to ponder about the volatility and objectives.

Volatility is still high, but a down move results in increasing volatility. So the best shorts start from small volatility. As said before, volatility and price objectives are closely linked together. 8940 is probably worst case objective but reaction lines (not shown) tell me it is an improbable scenario (at least not in straight line). I therefore favor more horizontal wandering for some time, … until we get exciting news like end of pandemic, or US election, or ????

Portfolio management – the myth of diversification

Continuing the myth busting series, we have now to challenge the way we are proposed to manage a stock or any securities portfolio.

Why are we supposed to diversify our portfolio? Finance people tell us that market is unpredictable, stocks go up and down and having a balanced portfolio allows to prevent wild swings for your money. Think about it for a moment!

Sorry guys, most people want to know how to go from A to B, I can’t guide you!

If some stocks go up and some go down, how performant is your portfolio going to be? Very average! A performance close to zero is probably what they expect you to do. Now you have an objective which is making as much money as you can (don’ t lie!) while having not too much stress, so let’s study the ‘one-stock portfolio’!

This strategy is actually a diversification kind of portfolio, but instead of using stocks from different sectors, … we will use time diversification for a single stocks. How does it work? Easy! Consider a stock for which the long term trend is up, for which you know there a sunny future, … Could be some AI, robotics, cannabis(?), …

Let’s consider Adobe Systems for the example. Adobe makes multimedia and creativity software products, digital marketing software. Adobe is also known for its Adobe Flash web software ecosystem, Photoshop image editing software, Adobe Illustrator vector graphics editor, Acrobat Reader, the Portable Document Format (PDF), … A long history of innovation and most likely a brilliant future ahead.

First step: Let’s look at the monthly chart:

Trend has been up for very long time, I do not advise to invest right now, but you see the idea. Start investing the first day of a month a number of stocks that matches your risk sensibility. See previous blog posts here or here . Beginning of next month, check where market is and how much money you still have at risk. If stop has gone up, voiding your risk, add extra stocks so you still have x$ at risk for the following month. You are accumulating by averaging up!

Second step: we diversify with the weekly chart.

We are closer to trading now. Add additional stocks to your portfolio when your trend indicator (a MACD in our example) confirms the price crossing over the red stop line. Use same criteria for line sizing! Exit those specific line when indicator crosses down its signal (don’t wait for the stop!)

Third step: we are going to boost the performance by trading the daily chart. Ideally you want to do that with CALL and PUT options, while considering your risk is 100%, should you misinterpret your chart.

You need to check momentum and volatility before entering your position. You need to master of course option trading, idea is of course to use here rather long term options. Exit when any of the indicator tells you to go out (stop or momentum or volatility). You may also use a stop much closer to the prices. When trading the down side, you are also covering for the down swings of your monthly positions so don’t expect huge gains these months, you are therefore also achieving portfolio volatility control via time diversification!

We like very much this strategy. We advise you to test it in details before trying it out for your portfolio. It does not work with all stocks. The dividends collected part of weekly and monthly lines are of course re-invested.

Note we have had this Adobe stock portfolio for real for the last 10 years. The yearly performance has gone to the 3-digits area a few times!

That’s it. Until next time, trade safely!

The boring market report – September 4th 2020

It had to come, it is there at last. The correction!

Yes, we can take this opportunity to go after Tesla or Apple, …. but we need to wait for markets to go back up again.

The current correction mirrors a messy period from August 2019, as highlighted by the orange circles. Of course, the trend is still up, but market will continue to be jumping up and down until next reaction line!

Situation is a bit more tricky for Bitcoin. Price targets are reached as usual on warning line levels, you just don’t know which one prices will stop at. Price target for the down move are 10250$, 9400$ and 8600$. Up trend will undoubtedly resume then as many professionals advise to buy some to protect yourself from the (virtual) printing of dollars by billions!

Gold is still above its random path, so we assume horizontal consolidation for now and we keep buying some more, for the same reason as Bitcoin.

That’s it for today. I will cover new subjects over the next weeks, from portfolio management to more technical or philosophical subjects. I will propose a tiny portfolio (10k$, 3 lines or technical volatile stocks) which will be updated on weekly basis.

Until next time, trade safely.

Secret new indicator makes trading easier!

When it comes to teasing potential subscribers for a newsletter, whether free or not, authors always mention a secret new indicator which detects the 10-baggers, stocks that can multiply by 10 in next few months. How disappointing when you find out it is about crossing the 1-year high! Such indicator indeed just does not exist, because stocks prices are moving because people are buying aggressively and not the opposite. We can predict with some accuracy where market has chance to make tops and bottoms in the near future based on volatility but exponential growth predictions can not be relied upon! Be cautious!

Brought to you by Cozy Dragon Trading Research Labs is a single new indicator that provides a sense of direction and timing never seen so far. It does not have any name so let’s call it Secret Indicator (SI). Let’s take a look at it!

Overlaid on price is our random walk path and just below the SI. If you are looking from the buy arrows, SI goes up keeps going up until the very day of trend reversal. Zero crossings of SI or its histogram can be used to trigger the buy action. There are a few finer rules to make the analysis fully reliable.

Please compare with RSI or STC indicators just below, causing many buy and sells orders because of whipsaws….

We can not disclose the formula behind this indicator. But we will use it in background for our market analysis!

That’s it for this back-from-vacations message. Until next time, trade safely.

Gone fishing…. The boring market report August 5th 2020

I have plenty of subjects to discuss in September and later. I want to spend three weeks far from Internet, the worldly (bad) news, … I will monitor my open positions, but not much more. I will not validate the hundreds of comments that I have undoubtedly when I come back!

S&P has gone through the last reaction lines quite harmlessly. Next one is not drawn yet but is much further away. This rally can continue for a while, unless something wrong happens! Your stop should be around 3100.

As written some time ago, you ought to have gold. Dollars and euros are printed faster than trucks can transport them where needed, so their value to the good old Gold is going down, so Gold goes up. Turbo has even been clenched for the pleasure of traders and investors alike.

If there is something that has been very pleasant these last days, it is the post-halving Bitcoin rally that has started. At last! Many other cryptos either anticipated (Etherum) or are following (Litecoin, Ripple). My portfolio shows massive gains in just a few days, and it is very likely that the rally will extend for a long time.. for the same reason as Gold!

You need to monitor the progress of virus and countermeasure applied in each country to anticipate a possible slowdown on stock market. Gold and cryptos may or may not correlate with stock market like during containment. Each needs specific attention.

That’s it. Until September, trade safely. Stay away from virus and wear a mask if needed: it is only a matter of probability, you are decreasing the chances to get sick. So be bullish on masks and bearish on the virus!

TTYL

The boring market report July 7th 2020!

If trading is your only occupation (not my case!), then life can be quite boring. The fact is you only need to wait… until there is a crisis or some excitement somewhere and then you enter the market, make your gains and go back to your boring life! Patience is key!

Summer time should be dull, shouldn’t it?

Anyway, a good time to look at all the funny articles on internet. Look at those two brilliant analysis:

https://www.tradingview.com/chart/BTCUSD/p9X91CHn-Possible-bitcoin-price-drop-to-around-1800-after-halving-in-May/

https://cointelegraph.com/news/bitcoin-is-the-new-apple-how-btc-price-could-reach-60-000-by-2023

What? One says 60k, the other one 1.8k? Predictions, pretty much like conspiracy theories, are fun to read but you can not make anything with this information!

Fact is bitcoin is enjoying for now a cool summer, on a small downward slope. Capital is flowing out quietly but Bitcoin stays above the random walk path. The objective for down move is about 8100$ but I do not see enough bearish energy. Should it resume the uptrend, then objective 10250$, not that much. Quite boring for crypto!

S&P500 continues on to next reaction line, which could be reached… next week! Maybe some sport is coming… or not!

As for the Nasdaq 100, a warning line was reached yesterday. As for S&P500, there is divergence with bottom indicator (the WAD2.0 if you follow!), only a warning of course. I hope you are in since mid-April, a stop at 10k is now the best idea you can have!

That’s it! Until next time, enjoy the summer, stay away from harmful virus and trade safely!